Your query returned 167 graphics.
Results 16 - 30
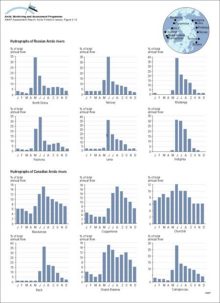
Monthly mean discharge expressed as a percent of annual discharge from available data for selected Russian and Canadian rivers draining to the ArcticMonthly mean discharge expressed as a percent of annual discharge from available data for selected Russian and Canadian rivers draining to the Arctic |
|
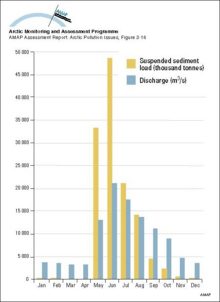
Comparison of monthly water and suspended sediment loads to the Mackenzie Delta plain for the period 1974-1983Comparison of monthly water and suspended sediment loads to the Mackenzie Delta plain for the period 1974-1983 |
|
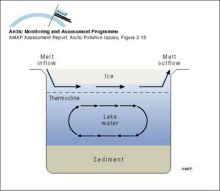
Illustration of the movement of less dense spring freshet water moving through a small Arctic lake underneath the surface ice cover, but not mixing with the water columnIllustration of the movement of less dense spring freshet water moving through a small Arctic lake underneath the surface ice cover, but not mixing with the water column |
|
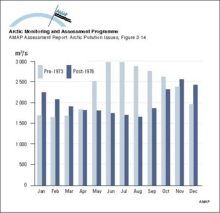
Monthly mean discharges for the Nelson River, Canada for the period 1960 to regulation in 1973, compared to post-regulation discharges from 1976 to 1990Monthly mean discharges for the Nelson River, Canada for the period 1960 to regulation in 1973, compared to post-regulation discharges from 1976 to 1990 |
|
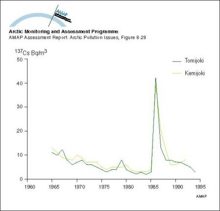
Changes with time in activity concentration of 137Cs in Finnish riversChanges with time in activity concentration of 137Cs in Finnish rivers |
|
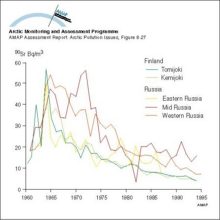
Changes with time in activity concentration of 90Sr in Russian and Finnish riversChanges with time in activity concentration of 90Sr in Russian and Finnish rivers |
|
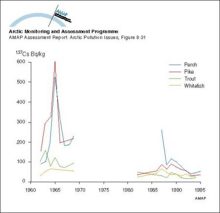
Changes with time in activity concentration of 137Cs in freshwater fish in Arctic FinlandChanges with time in activity concentration of 137Cs in freshwater fish in Arctic Finland |
|
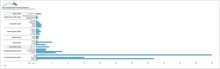
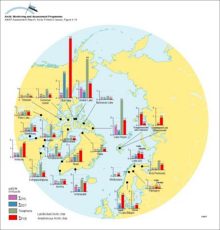
Average concentrations (ng/L) of sum-HCH in Arctic rivers in 1993Average concentrations (ng/L) of sum-HCH in Arctic rivers in 1993 |
|
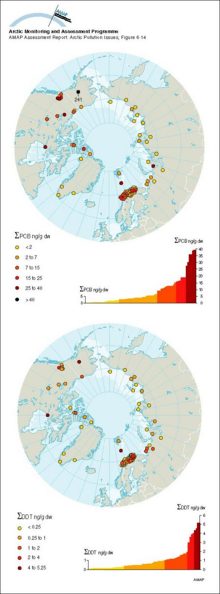
Concentrations of sum-PCB and sum-DDT in surface sediments (from grab samples or from top slices of cores) on a circumpolar basis, and the ranked distribution of valuesConcentrations of sum-PCB and sum-DDT in surface sediments (from grab samples or from top slices of cores) on a circumpolar basis, and the ranked distribution of values |
|
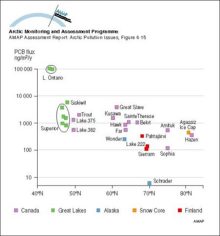
Latitudinal fluxes of sum-PCB in dated sediment cores from 25 locations including 13 Arctic locations (in Canada, Finland, and Alaska)Latitudinal fluxes of sum-PCB in dated sediment cores from 25 locations including 13 Arctic locations (in Canada, Finland, and Alaska) |
|
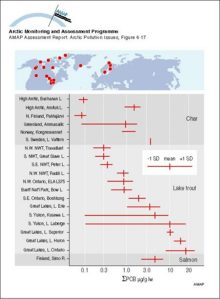
Comparison of sum-PCB concentrations (lipid normalized) in Arctic versus temperate zone salmonid fish See Annex Table 6A9 for wet weight concentrationsComparison of sum-PCB concentrations (lipid normalized) in Arctic versus temperate zone salmonid fish See Annex Table 6A9 for wet weight concentrations |
|
OC levels (µg/g lw in muscle) in landlocked and anadromous (italic labels) Arctic charOC levels (µg/g lw in muscle) in landlocked and anadromous (italic labels) Arctic char |
|
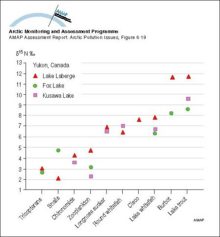
Mean delta-15 nitrogen (ppt) for invertebrates and fish collected from Laberge, Fox, and Kusawa LakesMean delta-15 nitrogen (ppt) for invertebrates and fish collected from Laberge, Fox, and Kusawa Lakes |
|
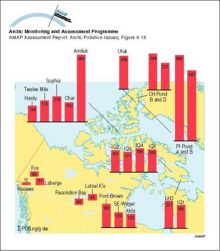
Geographic trends of sum-PCBs in zooplankton (>100 µm) in northern Canadian lakes All concentrations in ng/g dwGeographic trends of sum-PCBs in zooplankton (>100 µm) in northern Canadian lakes All concentrations in ng/g dw |
|
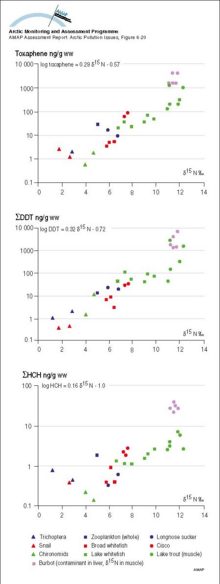
delta-15 Nitrogen isotope ratios versus Toxaphene, DDT, and HCH for fish and invertebrates from Lake Laberge, Yukon Territorydelta-15 Nitrogen isotope ratios versus Toxaphene, DDT, and HCH for fish and invertebrates from Lake Laberge, Yukon Territory |
|

water OR waste searches for either of these words
oceans AND biodiversity searches for blocks with both words
pollution NEAR water searches for blocks with either of these words, with them being closer ranks higher
"climate change" searches for this phrase