Your query returned 167 graphics.
Results 1 - 15
A comparison of the structures of the Bergen, Toronto, and Combined zonally-averaged global modelsA comparison of the structures of the Bergen, Toronto, and Combined zonally-averaged global models |

|
Distribution of potential temperature, salinity, and density across the Arctic Ocean and the Greenland and Norwegian SeasDistribution of potential temperature, salinity, and density across the Arctic Ocean and the Greenland and Norwegian Seas |

|
Temperature and salinity of the Labrador Sea The cold freshwater from the Arctic Ocean and Baffin Bay is seen above the continental shelfTemperature and salinity of the Labrador Sea The cold freshwater from the Arctic Ocean and Baffin Bay is seen above the continental shelf |

|
Schematic representation of the temperature and salinity structure of the upper Arctic Ocean and how the halocline layer is maintained by brine-rich water produced on the shelvesSchematic representation of the temperature and salinity structure of the upper Arctic Ocean and how the halocline layer is maintained by brine-rich water produced on the shelves |

|
Seasonal and annual average surface temperature trends (°C per decade) over the northern hemisphereSeasonal and annual average surface temperature trends (°C per decade) over the northern hemisphere |

|
Lower stratospheric temperature record since 1979Lower stratospheric temperature record since 1979 |

|
Lower stratospheric (ca 120-40 hPa) Arctic temperature trends (°C per decade, January 1979 to February 1996), as monitored by MSUs on polar orbiting satellitesLower stratospheric (ca 120-40 hPa) Arctic temperature trends (°C per decade, January 1979 to February 1996), as monitored by MSUs on polar orbiting satellites |

|
Lower tropospheric Arctic temperature trends (°C per decade, January 1979 to February 1996), as monitored by MSUs on polar orbiting satellitesLower tropospheric Arctic temperature trends (°C per decade, January 1979 to February 1996), as monitored by MSUs on polar orbiting satellites |

|
History of temperature changes in central Greenland over the last 40 000 years, from the GISP2 core, showing very large and probably abrupt changesHistory of temperature changes in central Greenland over the last 40 000 years, from the GISP2 core, showing very large and probably abrupt changes |

|
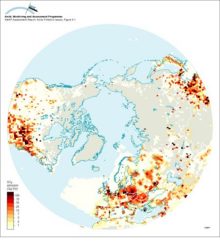
Anthropogenic SO2 emissions for 1985 north of 30°NAnthropogenic SO2 emissions for 1985 north of 30°N |
|
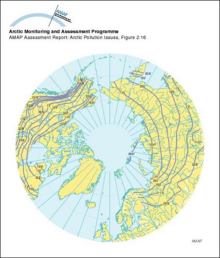
River break-up in the ArcticMean dates of river break-up in the Arctic; month number in Roman numerals |
|
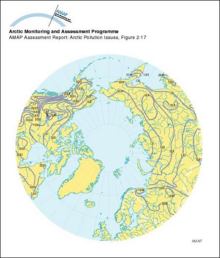
River freeze-up in the ArcticMean dates of river freeze-up in the Arctic |
|
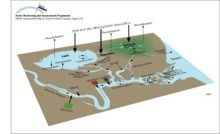
Conceptual model of the terrestrial/freshwater compartment showing the main subcompartments and contaminant transfers, and exchanges with the atmosphere and oceansConceptual model of the terrestrial/freshwater compartment showing the main subcompartments and contaminant transfers, and exchanges with the atmosphere and oceans |
|
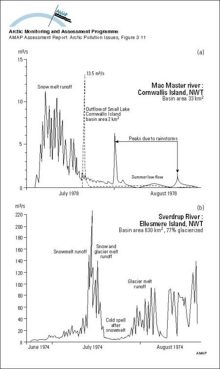
Hydrographs showing two types of streamflow regimes for Arctic rivers: a) Arctic nival regime and b) proglacial regimeHydrographs showing two types of streamflow regimes for Arctic rivers: a) Arctic nival regime and b) proglacial regime |
|
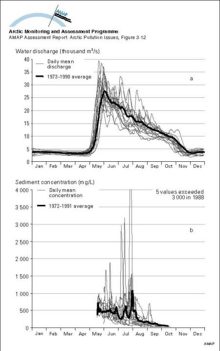
a) The annual (1973-1990) and mean annual hydrographs for the Mackenzie River above the Arctic Red River, NWT, Canada, indicating the dominance of the spring freshet in Maya) The annual (1973-1990) and mean annual hydrographs for the Mackenzie River above the Arctic Red River, NWT, Canada, indicating the dominance of the spring freshet in May |
|

water OR waste searches for either of these words
oceans AND biodiversity searches for blocks with both words
pollution NEAR water searches for blocks with either of these words, with them being closer ranks higher
"climate change" searches for this phrase