You are searching within the geographical region Arctic Ocean.
Other related regions to search.
Your query returned 26 graphics.
Results 16 - 26
Other related regions to search.
Your query returned 26 graphics.
Results 16 - 26
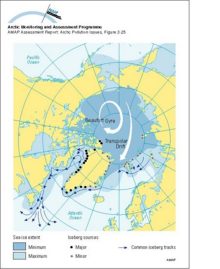
Main sources of icebergs and common iceberg drift trajectories The main ice circulation pattern follows the Transpolar Drift in the eastern Arctic and the Beaufort Gyre in the western Arctic (white arrows)Main sources of icebergs and common iceberg drift trajectories The main ice circulation pattern follows the Transpolar Drift in the eastern Arctic and the Beaufort Gyre in the western Arctic (white [..] |
|
Distribution of radioactivity (PCi/L) in the surface layer of the ocean after ten years of simulation of Preller's model Source locations are the Ob, Yenisey and Pechora Rivers, as well as SellafieldDistribution of radioactivity (PCi/L) in the surface layer of the ocean after ten years of simulation of Preller's model Source locations are the Ob, Yenisey and Pechora Rivers, as well as Sellafield |

|
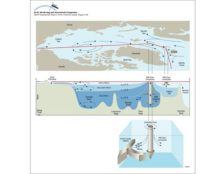
Circulation and water mass structure in the Arctic Ocean and Nordic Seas Mixing processes, such as brine formation, result in denser water that is transported off the shelves and into the deep basinCirculation and water mass structure in the Arctic Ocean and Nordic Seas Mixing processes, such as brine formation, result in denser water that is transported off the shelves and into the deep basin |
|
Average annual maximum and minimum sea ice extent The numbered lines show the expected time in years for the ice at that location to exit the Arctic Ocean through the Fram Strait, based on drifting buoy data during 1979-1990Average annual maximum and minimum sea ice extent The numbered lines show the expected time in years for the ice at that location to exit the Arctic Ocean through the Fram Strait, based on drifting [..] |

|
Approximate net sea ice exchange (see legend for key to arrow sizes), extent of shorefast ice and winter sea ice, and coastal polynyas and main polynya concentrationsApproximate net sea ice exchange (see legend for key to arrow sizes), extent of shorefast ice and winter sea ice, and coastal polynyas and main polynya concentrations |
|
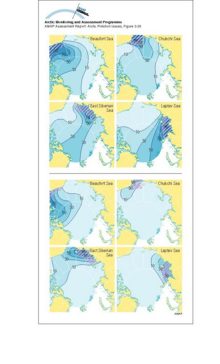
Above: contours of the asymptotic probability of ice formed in the hatched region moving into different parts of the Arctic Basin Below: contours of the asymptotic probability of ice moving from different areas into the hatched region and meltingAbove: contours of the asymptotic probability of ice formed in the hatched region moving into different parts of the Arctic Basin Below: contours of the asymptotic probability of ice moving from [..] |
|
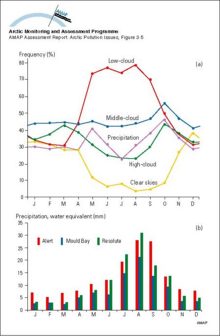
Cloud cover and precipitation in the Canadian High ArcticSeasonal variation in a) cloud cover and precipitation occurrence and b) precipitation amount in the Canadian High Arctic, 1951-1980 norms |
|
Composition of particles measured at different altitudes during winter flights in the Norwegian ArcticComposition of particles measured at different altitudes during winter flights in the Norwegian Arctic |

|
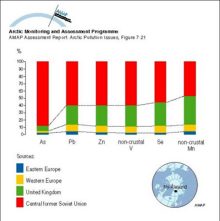
Average regional source apportionment of metals in winter aerosol at Ny-Ålesund, Svalbard from Europe and the central part of the former Soviet Union (including the Urals and Norilsk)Average regional source apportionment of metals in winter aerosol at Ny-Ålesund, Svalbard from Europe and the central part of the former Soviet Union (including the Urals and Norilsk) |
|
Average contributions from various sources to the atmospheric concentrations of elements in winter air samples at Ny-Ålesund, SvalbardAverage contributions from various sources to the atmospheric concentrations of elements in winter air samples at Ny-Ålesund, Svalbard |

|
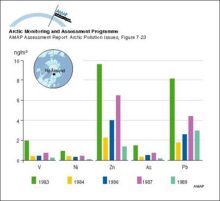
Atmospheric winter concentrations (median values) of metals measured in different years in the <25 µm aerosol fraction at Ny-Ålesund, SvalbardAtmospheric winter concentrations (median values) of metals measured in different years in the <25 µm aerosol fraction at Ny-Ålesund, Svalbard |
|
