You are searching within the geographical region Northern Hemisphere.
Other related regions to search.
Your query returned 409 graphics.
Results 316 - 330
Other related regions to search.
Your query returned 409 graphics.
Results 316 - 330
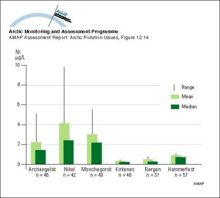
Nickel levels in urine from pregnant and delivering women in different areas of Russia and NorwayNickel levels in urine from pregnant and delivering women in different areas of Russia and Norway |
|
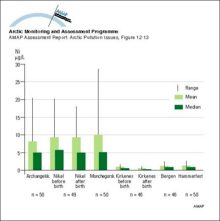
Nickel levels in urine from newborn children in different areas of Russia and NorwayNickel levels in urine from newborn children in different areas of Russia and Norway |
|
Lead concentrations in soil in Norway in 1975Lead concentrations in soil in Norway in 1975 |
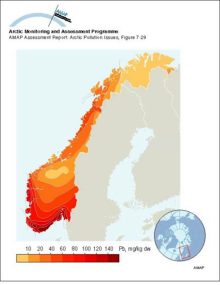
|
Latitudinal gradient of deposition of Pb in Norway in different years, as reflected by Pb concentrations in mossLatitudinal gradient of deposition of Pb in Norway in different years, as reflected by Pb concentrations in moss |
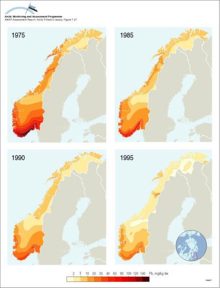
|
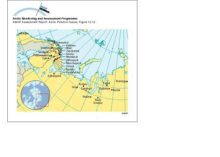
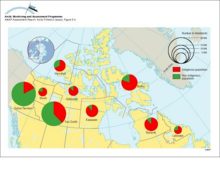
Human health study locations in Arctic Norway, Russia and Finland; red dots indicate the main communities studied under the AMAP monitoring programmeHuman health study locations in Arctic Norway, Russia and Finland; red dots indicate the main communities studied under the AMAP monitoring programme |
|
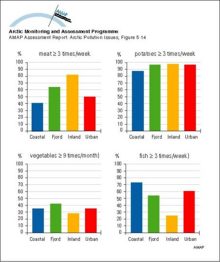
Frequency of consumption of food categories by Saami in Norway, percent of respondents, by society typeFrequency of consumption of food categories by Saami in Norway, percent of respondents, by society type |
|
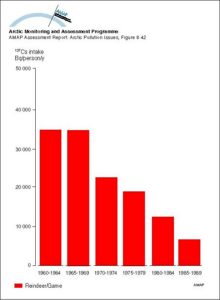
Dose estimates based on wholebody measurements (see Figure 836) for two groups (northern Saami and southern Saami) of Norwegian reindeer-breeding SaamiDose estimates based on wholebody measurements (see Figure 836) for two groups (northern Saami and southern Saami) of Norwegian reindeer-breeding Saami |

|
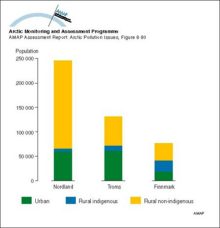
Distribution of the population of the three Arctic Norwegian countiesDistribution of the population of the three Arctic Norwegian counties |
|
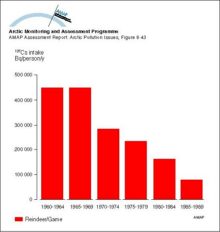
Yearly intake of 137Cs from various dietary components by the average population of Arctic CanadaYearly intake of 137Cs from various dietary components by the average population of Arctic Canada |
|
Yearly intake of 137Cs from various dietary components by the ‘selected’ population of Arctic CanadaYearly intake of 137Cs from various dietary components by the ‘selected’ population of Arctic Canada |
|
Trends in sum-PCB, sum-DDT, sum-CHL, and toxaphene over a ten year period (20 years for DDT in the Mackenzie Delta) for male narwhal and beluga blubber samples from the Canadian Arctic (N=8-26)Trends in sum-PCB, sum-DDT, sum-CHL, and toxaphene over a ten year period (20 years for DDT in the Mackenzie Delta) for male narwhal and beluga blubber samples from the Canadian Arctic (N=8-26) |

|
Trends in concentration of major organochlorines in blubber of female ringed seals over 6 to 10 years at 3 sites in the eastern Canadian Arctic (N=10-14 animals for each year/site)Trends in concentration of major organochlorines in blubber of female ringed seals over 6 to 10 years at 3 sites in the eastern Canadian Arctic (N=10-14 animals for each year/site) |

|
Trends in (annual average) ozone mixing ratio over Canada from 1980 to 1993Trends in (annual average) ozone mixing ratio over Canada from 1980 to 1993 |

|
Total and indigenous populations of Arctic CanadaTotal and indigenous populations of Arctic Canada |
|
Time trends of mean methylmercury concentrationsTime trends of mean methylmercury concentrations |

|
