About Coastal Fish Monitoring GIS
Background
Coastal fish communities are important components of Baltic Sea ecosystems. These communities consist of fish of various origins: marine species, freshwater species, migratory species, and glacial relicts. Representatives of these categories have different preferences for environmental conditions. For example, marine fish prefer more saline areas, freshwater fish prefer less saline areas, and glacial relicts are more abundant in cold-water layers in deeper areas. The composition of coastal fish communities varies in the different regions of the Baltic Sea in relation to the different habitat characteristics of these regions, with salinity, water temperature, and nutrient availability among the important factors. Other important factors include seabed type for bottom-dwelling fish, and algal and seagrass conditions in shallow waters for near-coastal species.
Coastal fish communities are impacted by human activities, including fishing, runoff or discharges of nutrients, heavy metals, and toxic organic contaminants from agriculture, industry, or municipalities, the construction of structures affecting the habitat, and shipping (oil discharges, antifoulants, and transport of non-native species).
In order to determine the potential effects of human activities on coastal fish communities, as well as the amelioration of effects when measures have been taken against particular sources of human impact, a programme of annual monitoring of coastal fish in the Baltic Sea was initiated in the mid-1980s. The coastal fish monitoring programme is to be conducted according to a specific procedure in terms of the fishing gear and amount of fishing effort used, so that the results can be compared among the areas monitored. Fourteen areas are currently being monitored using three specific types of gillnets along the coasts of the Baltic Proper, the Gulf of Bothnia, the Gulf of Finland, and the Gulf of Riga, by Sweden, Finland, Estonia, Latvia, and Lithuania. Poland also participates at a fifteenth area along its coast, but employs a different type of sampling gear so the results are not comparable with those using gillnets. The “Co-ordination Organ for Baltic Reference Areas” (COBRA) coordinates this programme and maintains a database of the results. Data is provided by the Estonian Marine Institute, University of Tartu; Finnish Game and Fisheries Research Institute, Helsinki University; Institute of Ecology, Vilnius University, Lithuania; Latvian Fish Resources Agency; Provincial Government of Åland Islands and the Swedish Board of Fisheries. Fish in the coastal areas of Denmark, Germany, and Russia are also monitored, but results from these areas have not been included in this assessment.
For more information about coastal fish, see:
HELCOM Indicator Fact Sheet: Temporal development of Baltic coastal fish communities and key species
HELCOM BSEP 103A: Assessment of Coastal Fish in the Baltic Sea (2006)
HELCOM BSEP 103B: Changing Communities of Baltic Coastal Fish. Executive summary: Assessment of coastal fish in the Baltic Sea (2006)
About coastal fish monitoring GIS
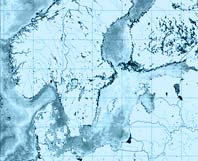
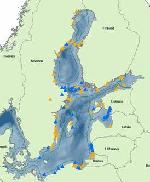
Coastal fish experts have been meeting on an annual basis since 2004 under the umbrella of HELCOM. In 2006, the expert group developed a metadatabase on monitoring activities, methods, parameters and species surveyed based on the data contained in the COBRA database. A GIS interactive map was subsequently created by HELCOM to improve access to the information in the metadatabase and to visualise coastal fish monitoring activities in the Baltic Sea.
The coastal fish monitoring GIS combines information on areas in the Baltic Sea where experimental surveys are carried out on cold and warm water fish as well as where sampling of commercial catches are made. Metadata tables include, amongst other information, data on survey periods, methods used, species analysed, parameters measured, indices calculated as well as contact details for national experts. The interactive map also includes data layers on abundance of selected fish species at some of the coastal monitoring stations. Also some relevant background information such as coastline, bathymetry, territorial water boundaries, and sub-basin divisions are provided in the map.
The GIS interactive map includes various tools for viewing the data and access to documentation for all the datasets (metadata) including details about data history and data quality. The data is projected in Lambert Azimuthal Equal Area projection based on ETRS89 datum. The GIS service is administered and updated when necessary by the HELCOM Secretariat.
A few words about the abundance data included
Methodology:
A species may be present in or in vicinity of a sampling area even it was not found in the sampling gears. The most common reasons are:
a. that the species only occasionally occurs in shallow coastal areas during the sampling period (smelt, sprat).
b. that the local habitat of the sampling spots are unsuitable (smelt, Baltic herring, sprat).
c. that the gears are unsuitable to catch a species (pike, flounder, asp).
d. that the effort is low. The probability to catch rare species increases with increased effort.The catch values presented are collected exclusively from test fishing gears at shallow areas (0 – 6 m depth).
The monitoring methods used are targeted to demersal (bottom dwelling) species during the sampling time from late July to early September.
Only species whose catches is believed to reflect the true stock sizes are presented with abundance indices at distribution maps. Small species, pelagic species, species that don’t appear in coastal waters in August and early September and species with a body shape strongly deviating from the model species perch are excluded, since the catches probably do not reflect the true density.
Species found in the test fishing gears, whose catches are believed to reflect permanent occurrence but are not believed to reflect the true stock sizes, are presented with presence maps.
Fish of all length categories are included in the presented data.
The data used is catch-per-unit-effort per net expressed as numbers (CPUE).
Data is collected from two different sampling gears, Coastal Nordic nets and Net series (different gears are used at different monitoring areas). Although the methods possess different catchabilities for different fish species and sizes, no correction between the methods has been carried out.
Data from the period 2001 – 2006 is included, both from single/few year investigations and from annual long term monitoring programs.
Click here for the complete methodology document


