2. About Floods in the Mekong Basin
2.1 Flood magnitudes on the Mekong in their global context
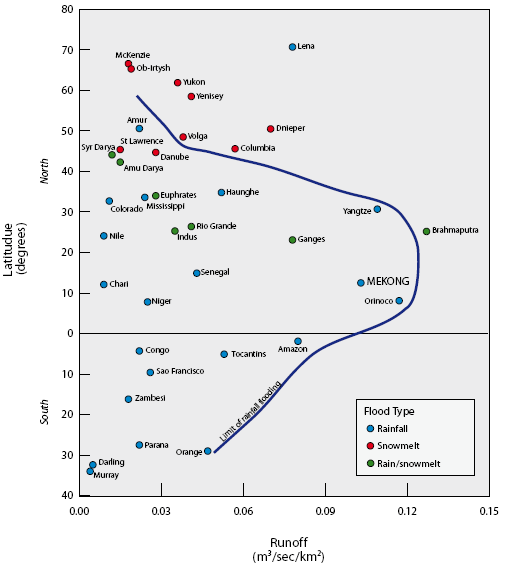

Figure 2. Above. The largest meteorological
floods reliably observed for
global river basins exceeding 500,000 km2 in area. The data
are expressed
as peak discharge per unit catchment area (cumecs/km2). The
plot is based
on data and figures given in OConnor and Costa (2004). See
also IAHS (2003).
Below. The largest such event on the Mekong was observed during
the 1939
flood season at Kratie, when the annual maximum discharge
was
66,700 cumecs, though this figure was almost certainly exceeded
in 1978
(see text).
The definitive feature of the hydrological regime of very large tropical monsoonal rivers, such as the Mekong, is that there is, in effect, just a single annual flood hydrograph in response to the SW Monsoon. On the mainstream and within its larger tributaries the vast geographic scale of the drainage systems means that the runoff responses to the individual storm events caused by monsoonal depressions tend to coalesce and therefore accumulate into a single seasonal flood hydrograph. It is therefore not generally possible to distinguish the runoff response to individual events unless the cyclonic storm system is very intense and regional in scale.
Tropical typhoon incursions into the basin from the South China Sea to the east and southeast across Viet Nam and southern China are the weather systems most responsible for generating distinct individual peaks to the monsoonal hydrograph. These generally occur during September and October when the seasonal discharge is already high and tend to generate a second significant peak to the annual hydrograph. Historically these events have been responsible for many of the most extreme flood discharges and water levels that have been observed within the Mekong system.
This highly seasonal and integrated nature of the flood hydrograph is revealed in Figure 1, where a comparison is made between the Mekong regime, that of two temperate catchments and the monsoonal flows of a much smaller river system in Pakistan. The flood hydrology of the temperate zone rivers is non-seasonal, with seemingly random flood pulses throughout the year. This is the case even for extremely large river basins such as the Rio Uruguay in South America. The Chenab is a large tributary of the Indus, where the monsoonal onset in June parallels that of the Mekong. Here, the additional earlier flood rise from March to May is a response to spring snowmelt runoff in Jammu and Kashmir. There is a clearly defined flood season, though the scale of the drainage basin is such that there is considerable noise in the data, that is a great number of large but short term fluctuations in discharge. As catchment scale increases these relatively rapid variations in flow are smoothed out as the longer duration responses to each storm episode coalesce, resulting in the highly coherent hydrograph of the Mekong at Kratie in Cambodia, where the drainage area is almost twenty times greater than that of the Chenab at Marala.

Figure 3. Locations referred to
in the main text.
This convergence and accumulation of monsoonal flood runoff into a single seasonal hydrograph places the Mekong amongst the global river systems within which the largest meteorological floods have been recorded. These lie within the tropics, especially where drainage basins, producing immense volumes of runoff. Such systems include the Brahmaputra, Ganges, Yangtze, Mekong, and Huang He (Yellow) River Basins. Accordingly, the flood hazard amongst these densely populated tropical river basins is extremely high. The worst flood disaster in recorded history occurred in August 1931, along the Yellow River and Yangtze Rivers in China, killing an estimated four million people as a result of the event itself and the ensuing famine (OConnor and Costa, 2004).
Records of the worlds largest floods observed on the largest catchments, that is those exceeding 500,000 km2, are shown plotted on Figure 2, where it can be seen that the Mekong is indeed amongst the global maxima1 . The data are expressed as peak flood discharge per unit basin area or cumecs/km2. The record historical event observed for the Mekong on this basis occurred on 3rd September 1939 at Kratie in Cambodia, where the drainage area is 646,000 km2 (see Figure 3 for a map of locations referred to in the text). This 1939 hydrograph is included in Figure 2, though it is almost certain that the peak discharge of 66,700 cumecs was exceeded in 1978 when the maximum historical peak flow between 1924 and 2006 was observed upstream at Pakse. At this time, only water level observations are available further downstream at Kratie, but based on a statistical analysis of the historical joint distribution of daily flows between these two mainstream locations, it is reliably estimated that the 1978 peak at Kratie was in excess of 77,000 cumecs, which places the Mekong even closer to the global limit for rainfall generated flood runoff.
There is a pronounced global pattern to the distribution of these extreme meteorological floods2 . They are generally confined to areas of the tropics between 10 and 30 degrees north in Asia and between 10 degrees north and south of the equator in South America. The large rivers of tropical Africa, such as the Congo, have relatively modest flood regimes in terms of unit area discharge, which is attributable to a combination of low relief and less extreme tropical rainfall climates.
2.2 The historical geography of floods on the Mekong mainstream

Figure 4. The geography of the flood
prone areas in the Lower
Mekong Basin compared to the distribution of population.
The geographical distribution of significant flood hazard in the Lower Mekong Basin shows a close link to that of the regional population (Figure 4). Regions of high population density are generally those most exposed to flood inundation. This is consistent with the fact that in tropical regions floodplains provide the most fertile land areas and historically therefore they have witnessed the greatest levels of socio-economic development. A meaningful knowledge of the nature, history and geography of the regional flood regime is therefore basic to effective flood mitigation and management.
The annual flood regime of the Mekong is not geographically homogeneous in terms of its nature and magnitude from year to year. There is a significant discontinuity evident between the hydrological sub-regions upstream and downstream of Vientiane. The explanation is, however, quite straightforward. Upstream of Vientiane the nature of the flood hydrology in any year is dictated by outflows from Tibet and Chinathe so called Yunnan Component of the overall Mekong regime. Downstream, the large left bank tributaries, particularly those that lie in Lao PDR (the Nam Ngum, Nam Theun, Se Bang Hieng and the Se Kong) and the Se San and Sre Pok, which enter the mainstream from Cambodia and Viet Nam, progressively mask the Yunnan Component. It is their contribution to the mainstream flow that becomes the foremost influence on the variability of flood season conditions from year to year. (See Figure 5, which maps this regional geography of the Mekong flood regime.) Because the incidence, severity and impact of the weather systems that determine the magnitude of the annual flood, such as monsoonal depressions and typhoons, is not necessarily common between these two hydrological subregions in any year, there can be significant geographical differences in the annual flood hydrograph.

Figure 5. The geography of the
major hydrological sub-
regions that contribute to the spatial non-homogeneity of
the flood regime of the Mekong mainstream.
In any year the annual Mekong flood may be above or below normal and this departure outside of the normal range may be significant or extreme. A basis for an analysis of the historical and geographical variability of the annual flood along these lines is presented in Figure 6. At Kratie, the mean annual flood volume between 1924 and 2006 is 333 km3 and as the frequency histogram shows, there has been a considerable historical variability either side of this mean value. The distribution of these volumes can be approximated using a Normal Distribution, as shown in the lower plot, and this enables their risk and recurrence intervals to be estimated. Normal flood years are defined as those when the flood volume lies within the 1:10 year range, equivalent to a 10% or less annual probability of occurrence. Significant flood years are distinguished as those with an annual recurrence interval greater than 10 years and extreme years those with an annual recurrence interval greater than 20 years, equivalent to an annual probability of occurrence of 5%. The annual flood volumes above and below the mean are indicated for both Vientiane and Kratie.
On the basis of this classification, Figure 7 portrays the historical geography of floods along the Mekong mainstream between Chiang Saen and Kratie for the 47 years from 1960 to 2006. The annual flood season flow volumes for each year at ten of the major river gauging locations have been classified as described into significantly and extremely above and below normal. The result is the flood category matrix, as shown in the figure:
- The discontinuity up and downstream of Vientiane is clearly distinguishable. For example, the largest flood event recorded at Chiang Saen, Luang Prabang, Chiang Khan and Vientiane, in 1966, diminishes in severity downstream. At Pakse and beyond conditions in 1966 fall into the normal range. This came about because this flood was the result of Typhoon Phyllis which tracked over northern Lao PDR and southern Yunnan, where extreme levels of runoff were generated in late September. Phyllis did not have any significant impacts further towards the south, where flood season volumes were unexceptional. Consequently there was an insufficient further accumulation of the annual flood volume for it to remain classified as severe or significant beyond Khong Chiam. A rather similar situation came about in 1971.
- Correspondingly, ‘significant’ and ‘severe’ large annual floods can be confined to the hydrological sub-region downstream of Vientiane, as is the case during 2000, 2001 and 2002. This occurs during years when monsoonal depressions and tropical storms generate exceptional volumes of flood runoff within the large left bank tributary catchments, while monsoonal rainfall upstream of Vientiane is less excessive.
- In some years, the occurrence of these exceptional flood volumes can be even more confined geographically, for example in 1961 and 1978. This is generally due to tropical storms and typhoons tracking over the far south of the Mekong system only. This was the case in 1978 when Typhoon Joe moved in over these downstream regions and was responsible for the highest annual flood peak recorded at Pakse (56,000 cumecs) and Kratie (77,000 cumecs) over the past 80 or more years (see Chapter 2 and Figure 2). Upstream, in contrast, the 1978 flood season was unremarkable both in terms of peak and volume.
- ‘Significantly’ and ‘extremely’ below average annual flood volumes can also exhibit this same type of geographical non-homogeneity. For example, during 1977, 1988 and 1998 such conditions were largely confined the regions downstream of Vientiane. An exception is 1992 (Figure 8), a year during which daily discharges during the flood season rarely came even close to their long term average and the seasonal flood volume fell to more than 40% below normal (see Figure 8). These unprecedented conditions existed throughout the basin.


Figure 6. Frequency histograms of the historical distribution of the annual flood volumes on the Mekong mainstream at Vientiane (left) and Kratie (right). In each case these are Normally distributed, on the basis of which the annual flood volumes are classified as significantly and extremely above or below their normal range. A significant year corresponds to a flood with a recurrence interval exceeding 1:10 years (10% annual probability) and an extreme year to a flood with a recurrence interval exceeding 1:20 years (5% annual probability).
2.3 The nature and analysis of floods on large rivers


Figure 7. The historical geography
of the annual flood regime of the Mekong mainstream
(1960 2006). The matrix shows a simple classification of
the annual flood volume and
its inter-annual variability along the Mekong between Chiang
Saen and Kratie
(refer to text for discussion).
This quantitative definition of the magnitude of a flood exclusively in terms of its peak discharge is useful for the purposes preparing a global catalogue of extrema, as above, and in the case of small river basins where the duration of flood events is usually a matter of several days and the peak is a sufficient (fully informative) statistic of magnitude. However, in common with most episodic hydrological phenomena, floods are intrinsically multivariate events, characterised not only by their peak flow but also by their volume and the durations of discharge and water levels above critical thresholds.
Peak flows and water levels are related to the fact of inundation, its maximum depth and therefore to the levels of primary economic damage that are sustained. Secondary damage is largely the result of event duration and relates to the time that economic activity is suspended and to the cumulative social, structural, agricultural and sanitary impacts of long term inundation. As river basin size increases, secondary damage becomes an increasing proportion of total damage (see Anderson et al., 1993).
A simple but effective way of drawing together these aspects of the annual Mekong flood is through a scatter plot of the joint distribution of annual flood peak and volume over the period of record, as illustrated in Figure 9. The value of such a presentation is much improved if a simple means can be devised to sift out significant and extreme years. The proposed strategy is based on boxes or envelopes defined by one and two standard deviations of each variable above and below their respective mean values.
At Kratie, the mean annual flood peak over the 83 years between 1924 and 2006 is 52,000 cumecs, and the mean annual flood volume 335 km3, with standard deviations (äs) of 8,300 cumecs and 70 km3 respectively. Adding and subtracting 1ä and 2ä to and from the mean value of each variable prescribes the boxes. One standard deviation (1ä) away from the mean in either direction encompasses about 70% of the observations. Beyond two standard deviations (2d) from the mean only 5% of the observations would be expected to lie and beyond three only 1%.
Such plots readily provide significant insights into the flood history of the Mekong and how events in 2006 fit into the picture:
- At Kratie, the world envelope event of 1939 (quoted amongst the global data in Figure 2) is surpassed by the reliable estimate of 1978, when although the flood volume was similar, the peak discharge was much greater.
- The more recent extreme event of 2000 observed at Kratie killed more than 800 people and resulted in economic damage assessed at more than US$400 million (ADB figures). It was, however, entirely the result of an unprecedented flood volume of almost 480 km3. The flood peak was only marginally above average, with an average recurrence interval of less than five years (Appendix 2). Such an observation underscores the point that flood maxima alone are not a satisfactory measure of flood magnitude and therefore of potential flood damage on large rivers such as the Mekong.
- The flood conditions of 2006 at Kratie were significantly below average and in terms of the peak flood discharge, especially low, in fact at an estimated 36,900 cumecs the forth lowest annual maximum since 1924. The 2006 flood season therefore joins the assembly of low peak and low volume flood hydrographs of 1955, 1988, 1992, 1993, 1998 and 2004. A point to note is that since 1924, six of the seven driest flood seasons on record at Kratie have occurred during the last 20 years.
- Upstream, at Vientiane, 2006 flood mainstream conditions were conclusively average, both in terms of peak and volume. This difference in the conditions between here and Kratie and the fact that, other than the driest season on record (1992), there is little commonality with respect to the classification of the flood seasons from year to year, is a significant aspect of the regional flood hydrology.
- As expected, given this geographical pattern of the mainstream flood regime, the 2006 flood peak and volume further upstream at Chiang Saen were both average and consistent with those at Vientiane in terms of their historical content.

Figure 8. The largest (1978) and
smallest (1992) seasonal flood volumes observed within the
Mekong system at Kratie over the last 80 plus years. The
peak of the 1978 hydrograph exceeds that quoted in the World
Catalogue of Large Floods (IAHS. 2003) for 1939 (see Chapter
1).


Figure 9. Scatter plots of the
joint distribution of the annual maximum flood discharge
(cumecs) and the volume of the annual flood hydrograph (km3)
at Chiang Saen (1960 2006), Vientiane/Nong Khai (1913
2006) and at Kratie (1924 2006). The darker boxes
indicate one (1ä) and two (2ä) standard deviations for each
variable above and below their respective means. Events
outside of the 1ä box might be defined as significant flood
years and those outside of the 2ä box as historically extreme
flood years.


Figure 10. Bivariate probabilities of the joint distribution of annual flood peak and volume at Chiang Saen, Vientiane and Kratie. For example, points lying outside of the 1% isoline would have a recurrence interval in excess of 1:100 years, any outside of the 2% contour a recurrence interval great than 50 years, and so on.
A natural development of scatter plots such as these is the development of a bi-variate statistical theory for extreme values, within which the joint probability of combinations of flood peak and volume can be estimated. The development and application of such contemporary statistical methodology is reported in Adamson et al. (1999), using long term daily flow data for the Mekong to provide an example. The type of result that can be obtained is illustrated in Figure 10:

Figure 11. The definition of the
flood season, with the
mean annual hydrograph at Kratie as an example. The onset
is the date of the up-crossing of the long term mean annual
discharge
and the termination, the downcrossing. In typical years there
is only
one such crossing in each case.
- The plots show the bivariate density of flood risk, taking the two key components of the flood hydrograph simultaneously into account and setting them within a common probabilistic framework. In so doing a more complete picture of flood risk emerges. The isolines are of equal percentage probability. Flood years that lie outside of the 1% isoline would have a return period exceeding 1:100 years in terms of the relationship between flood peak and volume, those beyond the 2% isoline a 1:50 year recurrence and so on. Years that lie within the 50% probability contour may generally be regarded as being typical in terms of both flood peak and volume.
- At Vientiane, conditions during 2006 were typical, while those that were experienced in 1966 are estimated to have a risk of occurrence of between 50 and 100 years. Correspondingly, the extremely low flood peak and volume of 1992 have a joint risk of occurrence in excess of 1:100 years.
- At Kratie, circumstances in 2006 were such that the much lower than normal combination of peak and volume would not be expected more frequently than 1:5 years on average over the long term. By virtue of the fact that the severe 2000 event had an unexceptional peak combined with an exceptionally high volume, the estimated recurrence interval lies somewhere between 20 and 50 years.
- At Chiang Saen, data are only available since 1960, providing a sample size only half that at Vientiane and Kratie. Conditions in 2006 were, as has been already observed, on average. The extreme conditions of 1966 define what is generally regarded as a complete outlier within the historical record, combining an unprecedented peak discharge with an unprecedented flood volume (see Appendix 2).
2.4 Temporal aspects of the Mekong flood regime

Figure 12. The definition of the
onset and closure of the four flow seasons, based
on the mean annual hydrograph at Kratie. The annual minimum
daily discharge
usually occurs in early April (1). The doubling of this discharge,
generally in late May,
defines the start of the first transition season (2). This
ends when the flood season
starts (3). The second transition season defines the period
between the end of the
flood season (4) and the start of the dry (5), which occurs
when rates of daily flow
decrease become typical of base-flow recession. On average
the dry season onset
according to this definition is in late November.
An obvious omission from the material presented thus far is some definition of the flood season over which the flood volume is accumulated. There are two ways to approach this. One is simply to set calendar dates, which is by and large arbitrary. Another is to provide a definition that extracts meaningful information with respect to the onset and termination of flood conditions, how this timing and duration of the flood season varies from year to year and therefore whether the conditions under specific review are typical or otherwise. An intuitively attractive designation is that period of the year when discharge and water levels exceed their long term annual average.
In the case of Kratie, for example, the mean annual discharge is 13,600 cumecs, so in any year the flood season is that period when daily discharge is higher (Figure 11). A major advantage of this simple definition, other than the fact that it is logical in many ways, is that on the Mekong mainstream, during a typical year, there is usually only one up-crossing and a single downcrossing of this value. It is therefore quite precise. In years when there are more, and only in exceptionally dry years is this generally the case, then the latest up-crossing and down-crossing defines the season.
It would be irrational to define the rest of the year as the dry season, a point which is clear from the above figure. Work with the MRCs Environment Programme, supported by the Fisheries Programme, has in fact identified four flow seasons for the Mekong and The Annual Flood Report should accord with this wider inter-disciplinary perspective. In so doing the Report supports active coordination between disciplines and programmes and becomes relevant to a much wider readership. The four seasons and the measures that define their onset and termination are as follows:
- Transition Season 1: This is a period of the year when the river is not strictly speaking in flood but the dry season has clearly ended. Its onset is defined as the earliest date upon which the discharge rises to twice that of the minimum daily discharge observed in each year (see Figure 12). This occurrence confirms the fact that the hydrological response to monsoon rainfall is in progress. The arrival of this fresh seasonal runoff is extremely important biologically, most particularly as a cue to fish migration.
- Flood Season: This season begins when the flow exceeds the mean annual discharge.
- Transition Season 2: This transitional period describes a short season between the end of the flood season and the start of the dry. The annual flood has plainly come to a close, but the day to day decreases in discharge are far more rapid than those that are characteristic of the dry season itself. The rate of flow recession at this time of the year has important environmental linkages, for example with the draining of wetlands and the floodplain as well as with the timing of the flow reversal in the Tonle Sap. It is helpful that usually this transition season never extends from one year to the next, historically the latest date for its termination being mid-December.
- Dry Season: The second transition season comes to a close when the average day-to-day decrease in discharge becomes typical of so called baseflow conditions. The rates of flow recession or decrease that signal the start of the dry season were identified (on the basis of some research) as the onset of a rate of decrease in daily flows of 1%, averaged over two weeks. This proved to be a consistent indicator along the mainstream.

Figure 13. Historical onset and
duration of the four flow seasons at Vientiane
(19132005) and at >Kratie (19242005).
The onset dates and duration of these four seasons has been remarkably consistent and unchanged over the last century, and almost certainly over the last 5,000 to 6,000 years 3 . Figure 13 shows a temporal plot of the historical variation of these dates over the last 80 to 90 years at Vientiane and Kratie. Figure 14 sets them within a probabilistic framework.
- The timing of the onset and the duration of the seasons is virtually identical at Vientiane and Kratie, despite the fact that the hydrology of the former is dominated by the so called Yunnan component of the overall Mekong regime (see Chapter 5 of the Overview of the Hydrology of the Mekong Basin, MRCS, 2005), while at Kratie the flow regime is largely dictated by flows entering the mainstream from the large left bank tributaries in Lao PDR, downstream of Vientiane. The system is therefore entirely homogenous with regard to
- these temporal aspects of its hydrology. However, it is not homogenous with respect to the incidence and severity of floods from year to year upstream and downstream of Vientiane (See Chapter 2.2).
- The data presented in Figure 14 (over-page) indicate the probability that a season will start and end before a particular week of the year. For example, at Kratie there is 50% probability in any year that the flood season will begin before week 25 (24th30th June) and close before week 44 (4th10th November). More generally, these figures reveal that there is a very narrow window that defines the onset and closure of the seasons.
- The fact that there is no geographical variation with regard to long term average seasonal onset and conclusion along the mainstream is further emphasised in Table 1. The historical mean dates are virtually identical at the two sites. In addition, the very low values of the standard deviations about the means reveal just how predictable these dates are from year to year.
- Table 2 presents the onset and end dates of the seasons for 2006. In the case of the flood season, no date departs more than a week either side of its long term historical average, with the exception of the start of the flood season at Kratie, which was more than two weeks early. Taken as a whole, however, 2006 was an unexceptional year as far as these temporal aspects of its seasonal hydrology are concerned.
| Table 1. | Average calendar week number of the onset and conclusion of the various hydrological seasons defined for the Mekong mainstream and their historical standard deviations. Average calendar day is given for the flood season dates. | ||||
| Week of occurrence | |||||
| Annual calendar variable | Vientiane | Kratie | |||
| average | average | ||||
| Minimum discharge | 14 | 2.1 | 14 | 2.0 | |
| Dry season end | 21 |
1.9 |
20 |
1.7 |
|
| Flood season start | 25 (23rd June) |
2.2 |
25 (23rd June) |
1.9 |
|
| Flood season end | 45 (11th Nov.) |
2.1 |
44 (7th Nov) |
1.7 |
|
| Dry season start | 47 | 2.4 | 47 | 2.3 | |
| Table 2. | Onset and closure of the hydrological seasons during 2006, with average calendar day given for the flood season dates. | ||
Annual calendar variable |
Week of occurrence (2006) | ||
| Vientiane | Kratie | ||
| Minimum discharge | 13 | 17 | |
| Dry season end | 20 | 22 | |
| Flood season start | 28 (29th June) | 26 (6th June) | |
| Flood season end | 44 (5th Nov.) | 44 (1st Nov) | |
| Dry season start | 46 | 48 | |

Key
1. Sample probability of the timing of the annual minimum
discharge
2. Dry/flood transition season
3. Flood/dry season transition
| Week (k) in the year before which the flow season changes with probability P( K>k) | ||||||||||
| P(K>k) | Annual minimum discharge | End of dry season | Start of flood season | End of flood season | Start of dry season | |||||
| Vientn | Kratie | Vientn | Kratie | Vientn | Kratie | Vientn | Kratie | Vientn | Kratie | |
| 10% | 10 | 12 | 18 | 18 | 22 | 22 | 42 | 41 | 43 | 43 |
| 25% | 12 | 13 | 19 | 19 | 23 | 23 | 44 | 43 | 45 | 45 |
| 50% | 14 | 14 | 21 | 20 | 25 | 25 | 45 | 44 | 47 | 47 |
| 75% | 16 | 16 | 23 | 22 | 26 | 26 | 47 | 46 | 49 | 49 |
| 90% | 18 | 17 | 24 | 23 | 27 | 27 | 49 | 48 | 50 | 50 |
| Figure 14. | Mekong mainstream at Vientiane (19132005) and Kratie (19242005). Historical timing of the transitions between the flow seasons. The graph and summary table indicate the probability (P( K>k)%) that in any given year the minimum discharge and seasonal transitions will have occurred before week k (k=1,52 ). For example, at Kratie there is only a 10% chance in any year that the flood season will start before week 18 (late May) and a 90% chance that it will have already started before week 41 (end of June, early July). | |||||||||
_______________________________________
1 The data upon which this plot is based is given
in Appendix 9.
2 During the Quaternary Period, the largest known floods had a peak discharge of close to 20 million cumecs. These were, however, non-meteorological and were the result of the breaching of ice dams formed during glacial periods. Other cataclysmic floods result from the failure of other types of natural dams, such as blockages caused by landslides. For example, analysis of dam breaks reveals that the failure of a rock-slide dam on the upper Indus in Pakistan in 1841 triggered a peak discharge of 540,000 cumecs (see OConnor and Costa, 2004 and Schroder et al., 1991).
3 Results reported in Penny (2006), based on core samples recovered from the bed of the Great Lake in Cambodia, indicate a major change in the pollen assemblages found in the sediments at around 5,600 years before the present (BP). The change is from species characteristic of swamp environments to those characteristic of the seasonally flooded forests that prevail today. The transformation of the flora is a response to changing climatic patterns brought about by a reduction in the strength of the Southwest Monsoon and the development of the strongly seasonal weather patterns that typify the present regional climate.
Choose a newsletter: