3. The 2007 flood season
3.1 Hydrological aspects - the Mekong mainstream
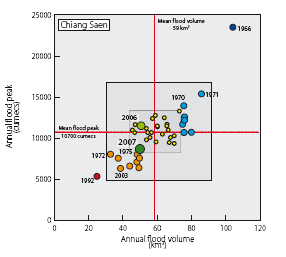
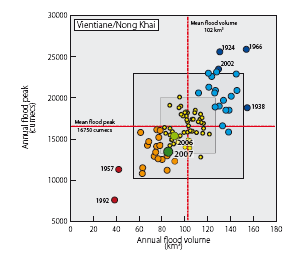
In terms of peak discharges and seasonal fl ood volumes, conditions during the 2007 fl ood season along the Mekong mainstream were comparable to those that occurred during 2006 (Figure 29). As then, both variables fell below their long term average values, the degree to which they did so becoming more pronounced downstream, such that at Kratie both fl ood peak and volume were signifi cantly below normal.

Figure 29. Scatter plots of the
joint distribution of the annual maximum fl ood discharge
(cumecs) and the
![]() volume
of the annual fl ood hydrograph (km3) at Chiang
Saen (1960 – 2006) , Vientiane/Nong
volume
of the annual fl ood hydrograph (km3) at Chiang
Saen (1960 – 2006) , Vientiane/Nong
![]() Khai
(1913 – 2006) and at Kratie (1924 – 2006). The 'boxes' indicate
one and two standard
Khai
(1913 – 2006) and at Kratie (1924 – 2006). The 'boxes' indicate
one and two standard
![]() deviations for each variable above and below their respective
means. Events outside of the
deviations for each variable above and below their respective
means. Events outside of the
![]() 1
box might be defi ned as ‘signifi cant’ flood years and those
outside of the 2 box as
1
box might be defi ned as ‘signifi cant’ flood years and those
outside of the 2 box as
historically ‘extreme’ fl ood years. ![]()
In fact flood conditions at Kratie during 2006 and 2007 are amongst the eight lowest observed since 1924, seven of which have occurred during the last 20 years. This intensification of the shortfall in peak and volume downstream of Vientiane points to significantly reduced monsoonal rainfalls within the catchments of the large left bank tributaries that lie in Lao PDR over the last two seasons. Conditions in the mainstream reaches where the flood hydrology is dominated by flows from the upper Mekong River in China, that is those upstream of Vientiane, tended to be much less anomalous and closer to average. This observation underscores the fact that the flood regime of the Mekong and the climatological conditions that drive it from year to year are not geographically homogenous.
These below average flood conditions were not, however, the definitive hydrological feature of the 2007 season. This lies with the fact that throughout the mainstream the start of the flood season was generally the latest observed over the last 80 to 90 years. Typically, the season begins in the last week of June or the first week of July in those reaches above Kratie and a week or two later at Phnom Penh and in the Delta in Viet Nam. The onset is defined as the first sustained ‘upcrossing’ of the long term mean annual discharge or water level (see the 2006 Annual Flood Report for a detailed discussion) which characterises the arrival of significant volumes of monsoonal runoff. Defined in these terms this onset date has a remarkably narrow variability from year to year, typically of plus minus two weeks. Departures outside of this ‘window’ are relatively rare occurrences.
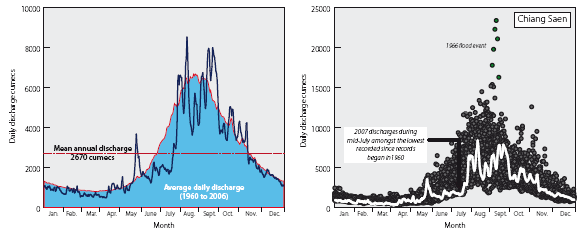
Events during 2007 are set out in Figure 30 and Table 10. In order to effectively illustrate just how atypical the flood season onset date was it is necessary to provide a picture of the flows on each day of the year over the complete period of record, since simply plotting the 2007 hydrograph against the long term average only provides the minimum degree of information and insight, as Figure 30 reveals.
- The scatter plots of historical daily flows across all years clearly reveal that conditions during 2007 were virtually unprecedented during July and early August.
- Compared to the mean historical daily flows during June and July, those over the same period in 2007 are clearly very low, particularly at Kratie. Here there was a ‘false start’ to the flood season during early July, but the higher flows were not sustained for more than a few days.
- The scatter plots reveal a much more detailed picture and the fact that throughout the mainstream within the Lower Mekong Basin flows by the end of July 2007 were amongst the lowest ever observed at this time of the year, indicating that the onset of flood conditions was very late. At Chiang Saen and Vientiane it was only during 1979 that the flood onset occurred later. At Kratie the 2007 flood onset was the latest observed over the 84 years since records began in 1924.
- These 2007 onset dates are summarised in Table 10 and compared with their historical average and standard deviation.
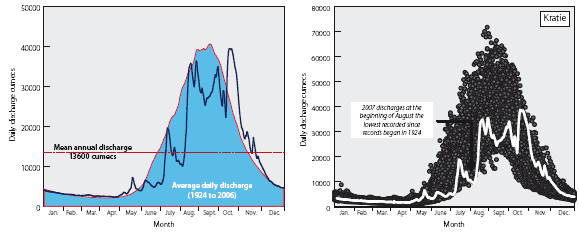
Figure 30. Mekong Mainstream
- historical mean and range of the annual daily flow hydrograph
at selected
sites compared to that for 2007![]()
Table 10. Onset and end dates of
the 2007 flood season compared to their historical mean and
standard
deviation at selected mainstream locations.![]()
| Site | Onset of flood season | End of flood season | ||||
| Historical average |
Standard deviation |
2007 | Historical average |
Standard deviation |
2007 | |
| Chiang Saen | 28th June | 14 days | 17th July | 14th November | 14 days | 7th November |
| Vientiane | 3rd July | 14 days | 25th July | 11th November | 15 days | 12th November |
| Kratie | 1st July | 16 days | 3rd August | 7th November | 12 days | 19th November |
- At all three sites the 2007 onset lay well beyond the typical window, as measured by the standard deviation. The extreme case is Kratie, where the 3rd August represents a delay of over a month or two standard deviations, which may be regarded as extreme.
- The end of the flood season, defined by the last ‘down-crossing’ of the long term mean annual discharge, generally falls within the ‘typical window’, as defined by one standard deviation.
Table 11. Duration of annual flood
season at selected mainstream sites. Site Average
historical duration of flood season. Duration of 2007 flood
season.![]()
| Site | Average historical duration of flood season. | Duration of 2007 flood season. |
| Chiang Saen | 139 days | 114 days |
| Vientiane | 132 days | 111 days |
| Kratie | 130 days | 109 days |
- The 2007 flood season was therefore an uncharacteristically short one (Table 11), which when combined with below average flood flows during August resulted in below normal flood volumes and maximum annual flood peak (Table 12) and a seasonal distribution of flows that was untypical, particularly downstream of Vientiane. (Figure 31).
Table 12. The 2007 flood peaks and
volumes compared to their historical averages at selected
![]()
mainstream locations.![]()
| Site | Period of record | Maximum annual
flood peak (cumecs) |
Annual flood
volume. (km3) |
|||||
| Historical average | 2007 | Historical average | 2007 | |||||
| Chiang Saen | 1960 – 2007 | 10,550 | 8500 | 57.2 | 49.3 | |||
| Vientiane | 1913 – 2007 | 16,700 | 13,800 | 100.0 | 83.8 | |||
| Kratie | 1924 – 2007 | 51,500 | 39,450 | 329.1 | 255.0 | |||
These results emphasise the importance of employing a meaningful definition of the onset and end of the annual flood season. It is a random variable in time and not a fixed temporal event linked to some prescribed calendar date. Only by using the type of definition used here will the anomalous situation such as that which occurred during 2007 be uncovered and a means to quantify the anomaly in terms of timing be available. In this context it is worthy of note that during July 2007 there was a wider public appreciation that the flows in the Mekong mainstream were uncharacteristically low for the time of year, thereby underscoring a general qualitative awareness of what is ‘normal’ and what is not. Being able to quantify such departures from so called ‘normality’ on a meaningful basis is a key function of such hydrological studies as the Annual Flood Report.
The distribution of flows during the 2007 flood season at all three sites was generally average in their lower range and below average in the higher ranges. This pattern became more pronounced in the lower reaches towards Kratie where the flood flows exceeded 50% of the time fell well below those that would be expected in a typical year. The pattern is largely explained by unseasonally lower than normal flows during August and September. Overall therefore the duration of discharges within the higher ranges was shorter than normal which would have resulted in a reduced period of inundation of the natural floodplain, particularly in Cambodia.
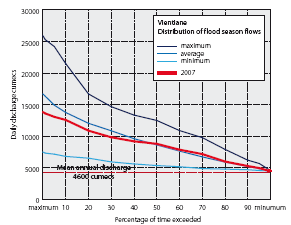
Figure 31. The distribution of
flood season flows during 2007 at Chiang Saen, Vientiane and
Kratie compared to their historical average and rang![]()
Choose a newsletter:
