2. The flood hydrology of the major tributaries in the Lower Mekong Basin (Continue)
2.9 Vientiane to Pakse the estimation of flood risk at un-gauged locations
The accelerating pace of hydropower development in the LMB means that there is a growing need for the development of a reliable procedures for the estimation of design flood risk at ungauged dam sites. Over recent years best practice has involved the use of regional methods based upon the pooling of data in regions and sub-regions that might be considered to be homogenous with respect to their flood hydrology. The Mekong between Vientiane and Pakse can be considered to be one such, though the left and right bank tributaries require separate treatment.
Figure 25 shows a plot of the relationship between tributary catchment area and mean annual flood peak discharge which illustrates this hydrological distinction between the left and right bank rivers:
- for a given catchment area, the mean annual flood on the right bank is considerably less than that on the left, reflecting the lower rainfall and flatter landscape within the Mun-Chi Basin;
- the levels of correlation between the two variables is such that 80 to 90% of the variation in the mean annual flood from site to site is explained by basin area alone for each subsample.
- linear relationships with these levels of significance mean that the mean annual flood at an un-gauged site can be estimated with reasonable reliability;
- note that the data for the Nam Ngum at Tha Ngon was not included in the estimation of the right bank regression due to the presence of the large reservoir upstream.
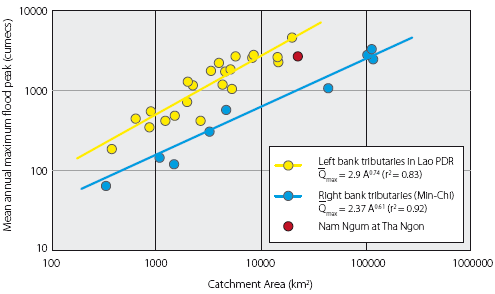
Figure 25. Vientiane to Pakse
relationship between catchment area and mean annual flood
![]() within
the left bank tributaries in Lao PDR and the right bank tributaries
in Thailand.
within
the left bank tributaries in Lao PDR and the right bank tributaries
in Thailand.
The next step in this regional methodology is to provide a means of scaling the mean annual event to obtain the T year flood. This is achieved by dividing out the data at each tributary site by the mean annual flood and then pooling the resultant modular data into a single regional sample. To these ratios the appropriate probability model is fitted to obtain the so called regional flood growth curve, the final results being illustrated in Figure 26. The statistical model selected in this case is the Two Component Extreme Value (TCEV) Distribution which acknowledges the fact that in tropical monsoon regions floods can often be separated into basic and outlier events, the former the result of normal storm rainfall and the latter the consequence of severe tropical storms and typhoons. The latter are much larger for the data observed in the Mun Chi Basin. That for the right bank tributaries in Lao PDR is more coherent and presents a probability distribution with only one component. This would tend to imply that here exceptional or outlier events are compatible in terms of magnitude and risk of occurrence with the main body of the sample and so no second component to the distribution of floods is identifiable.

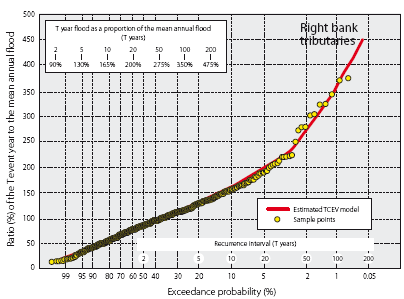
Figure 26. Vientiane to Pakse
ratio (%) of the T year event to the mean annual flood within
left bank tributaries in Lao PDR and the right
bank tributaries in Thailand.
2.10 Pakse to Kratie - the regional tributary systems
This reach of the Mekong, which accounts for 18% of the total basin drainage area, the tributary contribution to the mean annual flood volume at the delta is about 20%. At Kratie 90% of floodwater has already entered the system and downstream of there most of the balance is made up by the contribution of the Tonle Sap Basin in Cambodia. Of this 20% around 18% is accounted for by the combined Se Kong, Se San and Sre Pok Basins, which makes the largest single contribution to the total Mekong flood in most years, a point already illustrated in Figure 23.

Figure 27. Pakse to Krate - schematic
of the major Mekong tributary systems indicating
![]() the sites at which discharge data are available. (Numbers
refer to the right hand
the sites at which discharge data are available. (Numbers
refer to the right hand
column in Table 9.)![]()
The major constraint to hydrological analysis in this sub-region is a lack of representative data, which are distributed amongst only seven sites, as shown in Figure 27. With the exception of the gauge on the Se Done at Kong Se Done, which records the flows from 65% of the basin and the gauge on the Se Kong at Attapeau, the others on the Se Kong and Sre Prok are far upstream and only provide information about the hydrology of the headwaters (Tables 8 and 9). Meaningful estimates of the flood hydrology of these key regional river systems is therefore dependent upon hydrological modelling.
Table 8. Pakse to Kratie - major
tributaries to the Mekong mainstream.
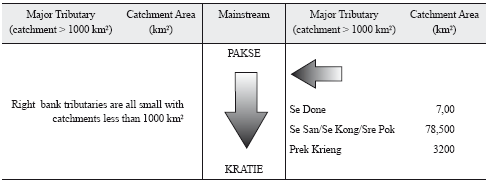
Table 9. Pakse to Kratie tributary
sites at which functional hydrometric data are available.![]()
(Sequence numbers refer to those in Figure 27.)![]()
| Sketch | Station No. |
River | Site | Catchment (km 2) |
Mean annual flow
(cumecs) |
||
| 1 | 390103 | Se Done | Saravane |
1172 | 40 | ||
| 2 | 390102 | Se Done | Kong Se Done |
5150 | 170 | ||
| 3 | 390104 | Se Done | Souvanna Khili |
5760 | 175 | ||
| 4 | 430105 | Se Kong | Attopeu |
10,500 | 430 | ||
| 5 | 440201 | Dak Bla | Kontum |
3060 | 100 | ||
| 6 | 440601 | Krong Poko | Trung Ngia |
? | 130 | ||
| 7 | 451305 | Sre Pok | Ban Don | 10,600 | 280 | ||
2.11 Pakse to Kratie - the hydrological assessment of extreme regional tributary flood events
This lack of representative data means that only a limited assessment of the tributary flood hydrology is possible, which is unsatisfactory given the pivotal role of the Se Kong, Se San and Sre Pok in the generation of extreme flood conditions across the Cambodian floodplain and in the Mekong Delta. As has already been established their contribution to the extreme regional flood of 2000 was major (Figure 23). This event was characterised by a peak flow at Kratie on the Mekong mainstream that was only marginally above average. It was the total flood volume over the flood season that was extreme, the highest observed since 1924 (see Figure 29).

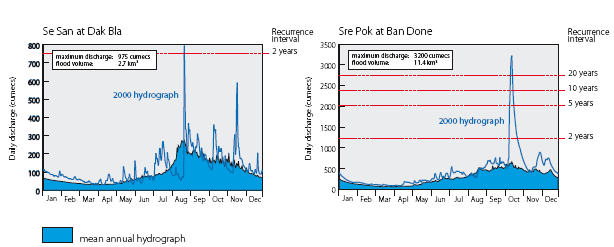
Figure 28. Annual hydrographs
for the 2000 flood on the Se Done and in the Se San, Se Kong
and Sre Pok.
These aspects of the 2000 event on the mainstream are reflected in the flows observed on the Se Done and Se Kong, indicated in Figure 28:
- The recurrence interval of the peak discharge in early September was only between two and five years. The seasonal flood volume, however, was up to twice the average figure and therefore exceptional.
- On the mainstream the flood season of 2000 began early and floodwater rapidly accumulated on the Cambodian floodplain. There is evidence that these tributaries contributed to this build up in May and June.
- The far upstream reaches of the Se San and Sre Pok at Dak Bla and Ban Don are distinctly different in terms of their flood hydrology, with evidence to suggest that they are affected by both the SE and NE Monsoons. Dry season flows are much higher than at Kong Se Done and Attopeu, with the occurrence of a significant number of spates. The peak event on the upper Sre Pok in October, with a recurrence interval in excess of 1:20 years is not evident elsewhere, which points to the local incursion of a severe tropical storm.
- There is also evidence to suggest that these Mekong left bank catchments have little natural storage. Throughout the LMB where the NE Monsoon has no effect, dry season flows are exceptionally small, as on the Se Done and Se Kong, indicating little carryover of water from the flood to the dry season.
- This lack of natural storage, the result of steep topography and geological conditions in the main, also explains the flashiness of the flood hydrology, with a very rapid rise to flood peak, followed by an equally rapid recession.
Choose a newsletter: