Your query returned 112 graphics.
Results 16 - 30
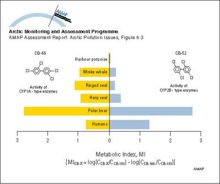
Cytochrome P450 1A (CYP1A) and cytochrome P4502B (CYP2B) type enzyme activities in some Arctic marine mammals and humans using the metabolic index (MI) suggested by Tanabe et al 1994aCytochrome P450 1A (CYP1A) and cytochrome P4502B (CYP2B) type enzyme activities in some Arctic marine mammals and humans using the metabolic index (MI) suggested by Tanabe et al 1994a |
|
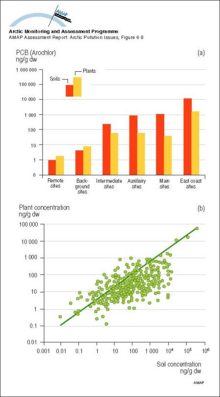
Concentrations of Aroclor PCBs in soils and plants (ng/g dw) associated with military radar sites in the Canadian Arctic a) Mean and maximum total PCB concentrations in soils and associated plants from remote (>20 km), backgroundConcentrations of Aroclor PCBs in soils and plants (ng/g dw) associated with military radar sites in the Canadian Arctic a) Mean and maximum total PCB concentrations in soils and associated plants [..] |
|
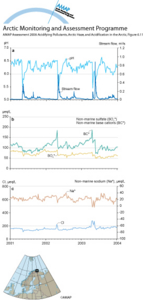
Surface water runoff from the Dalelva catchment, northeastern Norway, 2001–2003Surface water runoff from the Dalelva catchment, northeastern Norway, 2001–2003. (a) streamwater flow and pH, (b) non-marine concentrations of sulfate and base cations, and (c) chloride and non-marine [..] |
|
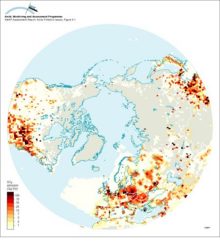
Contaminant emissions, transport and deposition in the ArcticAn illustration of the interplay between a) contaminant emissions distribution for sulfur dioxide and b) frequency of atmospheric south-to-north transport, yielding c) a net annual input of sulfur to [..] |

|
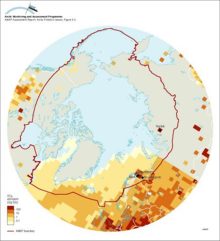
(a) Critical deposition of sulfur, and (b) its exceedance, in forest soils of northern Europe and Russia (5th percentile of the calculation points in each EMEP grid cell)(a) Critical deposition of sulfur, and (b) its exceedance, in forest soils of northern Europe and Russia (5th percentile of the calculation points in each EMEP grid cell) |

|
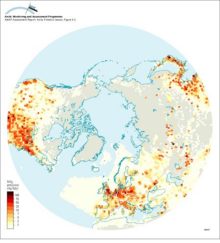
Anthropogenic SO2 emissions for 1985 north of 30°NAnthropogenic SO2 emissions for 1985 north of 30°N |
|
Anthropogenic NOx emissions for 1985 north of 30°NAnthropogenic NOx emissions for 1985 north of 30°N |
|
SO2 emissions north of 50°N (modified after Benkovitz et al 1995, see Figure 91) showing point source emissions from Arctic and subarctic non-ferrous smelters and including natural DMS sources from the North Atlantic Ocean Area sources are not includedSO2 emissions north of 50°N (modified after Benkovitz et al 1995, see Figure 91) showing point source emissions from Arctic and subarctic non-ferrous smelters and including natural DMS sources from [..] |
|
Time series of emissions of SO2 from European sources (Mylona 1993) and two major sources on the Kola PeninsulaTime series of emissions of SO2 from European sources (Mylona 1993) and two major sources on the Kola Peninsula |

|
The time series of (a) weekly-averaged non-seasalt (nss) sulfate aerosol at Alert, NWT, Canada, (b) monthly-averaged sulfate aerosol at Ny Ålesund, Norway, (c) weekly-averaged nitrate at Alert, and (d) weekly-averaged hydrogen ion at AlertThe time series of (a) weekly-averaged non-seasalt (nss) sulfate aerosol at Alert, NWT, Canada, (b) monthly-averaged sulfate aerosol at Ny Ålesund, Norway, (c) weekly-averaged nitrate at Alert, and [..] |

|
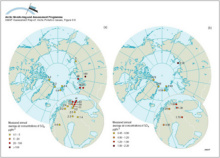
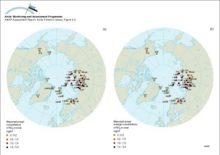
(a) Yearly average sulfur dioxide air concentration measurements in the Arctic, (b) Yearly average sulfate air concentration measurements in the Arctic(a) Yearly average sulfur dioxide air concentration measurements in the Arctic, (b) Yearly average sulfate air concentration measurements in the Arctic |
|
Emission rates of sulfur dioxide from Nikel together with annual average SO2 air concentrations measured at two sites in Norway (1978-1992)Emission rates of sulfur dioxide from Nikel together with annual average SO2 air concentrations measured at two sites in Norway (1978-1992) |

|
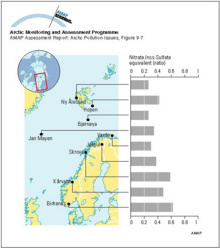
Variation of the nitrate to non-seasalt (nss) sulfate equivalent ratio in precipitation at Norwegian recording stations based on measurements between August 1982 and July 1984Variation of the nitrate to non-seasalt (nss) sulfate equivalent ratio in precipitation at Norwegian recording stations based on measurements between August 1982 and July 1984 |
|
Concentrations of (a) sulfate and (b) nitrate in snowConcentrations of (a) sulfate and (b) nitrate in snow |
|
Historical records of a) NO3- and b) SO42- concentrations from the Greenland icecap at Dye 3 c) A comparison of trends in the average SO42- and SO42- plus NO3- concentrations at Dye 3 in Greenland and in the annual mean H+ concentration from Agassiz iceHistorical records of a) NO3- and b) SO42- concentrations from the Greenland icecap at Dye 3 c) A comparison of trends in the average SO42- and SO42- plus NO3- concentrations at Dye 3 in Greenland [..] |

|

water OR waste searches for either of these words
oceans AND biodiversity searches for blocks with both words
pollution NEAR water searches for blocks with either of these words, with them being closer ranks higher
"climate change" searches for this phrase