Your query returned 71 graphics.
Results 16 - 30
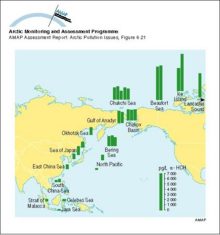
alpha-HCH (ng/L) in seawater: an illustration of the cold condensation effectalpha-HCH (ng/L) in seawater: an illustration of the cold condensation effect |
|
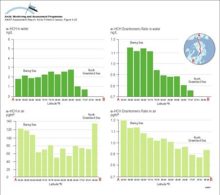
Trends in alpha-HCH and enantiomer ratios (ER) on a transect from the Bering Sea across the polar cap to the Greenland Sea during the Arctic Ocean Transect Study of July and August 1994Trends in alpha-HCH and enantiomer ratios (ER) on a transect from the Bering Sea across the polar cap to the Greenland Sea during the Arctic Ocean Transect Study of July and August 1994 |
|
Water/air fugacity ratios (fw/fa) of alpha-HCH and gamma-HCH on a transect from the Bering Sea to the Greenland Sea in July and August 1994 A fugacity ratio of 1 indicates air-water equilibriumWater/air fugacity ratios (fw/fa) of alpha-HCH and gamma-HCH on a transect from the Bering Sea to the Greenland Sea in July and August 1994 A fugacity ratio of 1 indicates air-water equilibrium |

|
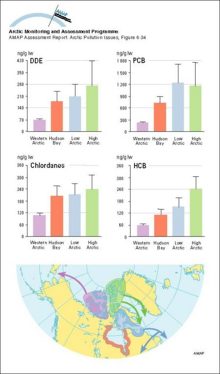
Migration patterns of four main stocks of eider ducks from the Canadian Arctic Organochlorines in the same four stocksMigration patterns of four main stocks of eider ducks from the Canadian Arctic Organochlorines in the same four stocks |
|
Correlations between concentrations (lw) of major persistent OCs and trophic level in the marine food web for Svalbard and Lancaster Sound Trophic level data were assigned based on Hobson and Welch (1992)Correlations between concentrations (lw) of major persistent OCs and trophic level in the marine food web for Svalbard and Lancaster Sound Trophic level data were assigned based on Hobson and Welch [..] |

|
Distribution of radioactivity (PCi/L) in the surface layer of the ocean after ten years of simulation of Preller's model Source locations are the Ob, Yenisey and Pechora Rivers, as well as SellafieldDistribution of radioactivity (PCi/L) in the surface layer of the ocean after ten years of simulation of Preller's model Source locations are the Ob, Yenisey and Pechora Rivers, as well as Sellafield |

|
Yearly and depth-averaged concentrations (Bq/m3) of 137Cs after 6 years from Harms' model The sources are instantaneous releases of 1 PBq from the dump sites in Abrosimov Bay, Stepovogo Bay, Tsivolky Bay, and Novaya Zemlya TroughYearly and depth-averaged concentrations (Bq/m3) of 137Cs after 6 years from Harms' model The sources are instantaneous releases of 1 PBq from the dump sites in Abrosimov Bay, Stepovogo Bay, Tsivolky [..] |
|
Vertically integrated tracer burden shown after 15 years Units are burden per unit surface area, normalized by cumulative release Bottom topography is in meters; a) no neptune, centered difference, and b) neptune, flux-corrected transportVertically integrated tracer burden shown after 15 years Units are burden per unit surface area, normalized by cumulative release Bottom topography is in meters; a) no neptune, centered difference, [..] |
|
Major pathways of contaminants into and within the Arctic environmentA multi-compartment schematic diagram of the major pathways of contaminants into and within the Arctic environment |

|
Contaminant emissions, transport and deposition in the ArcticAn illustration of the interplay between a) contaminant emissions distribution for sulfur dioxide and b) frequency of atmospheric south-to-north transport, yielding c) a net annual input of sulfur to [..] |

|
Seawater concentrations of 137Cs in the Barents and East Greenland Seas compared to the yearly releases from SellafieldSeawater concentrations of 137Cs in the Barents and East Greenland Seas compared to the yearly releases from Sellafield |

|
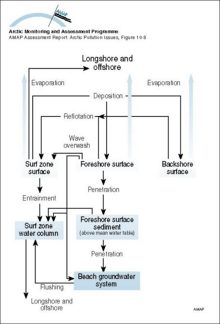
Mass transport pathways considered in the Coastal Zone Oil Spill Model (COZOIL), developed to simulate dynamic transport and weathering of oil on US Arctic coastsMass transport pathways considered in the Coastal Zone Oil Spill Model (COZOIL), developed to simulate dynamic transport and weathering of oil on US Arctic coasts |
|
An example of a positive feedback loop Warming leads to a decrease in sea ice cover which in turn leads to a decrease in albedo over the ocean, the result of which is further warming and further decreases in the sea ice coverAn example of a positive feedback loop Warming leads to a decrease in sea ice cover which in turn leads to a decrease in albedo over the ocean, the result of which is further warming and further [..] |

|
The hydrologic balance in the Arctic is highly dynamic on the seasonal time scale with large and rapid ice melts in the spring On land, this ice and snow melting results in large rapid floods and surges in riversThe hydrologic balance in the Arctic is highly dynamic on the seasonal time scale with large and rapid ice melts in the spring On land, this ice and snow melting results in large rapid floods and [..] |

|
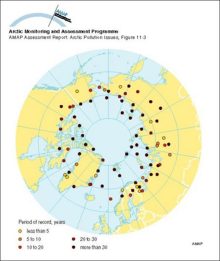
Locations of upper-air meteorological monitoring stations in the Arctic Meteorological station density for surface observations is greater for inland areas of the Arctic, while observations of any kind are sparse over the Arctic OceanLocations of upper-air meteorological monitoring stations in the Arctic Meteorological station density for surface observations is greater for inland areas of the Arctic, while observations of any [..] |
|

water OR waste searches for either of these words
oceans AND biodiversity searches for blocks with both words
pollution NEAR water searches for blocks with either of these words, with them being closer ranks higher
"climate change" searches for this phrase