PRODUCTIVITY INDICATORS
Primary productivity can be related to the carrying capacity of an ecosystem for supporting fish resources (Pauly and Christensen 1995). It has been reported that the maximum global level of primary productivity for supporting the average annual world catch of fisheries has been reached, and that further large-scale unmanaged increases in fisheries yields from marine ecosystems are likely to be at trophic levels below fish in the marine food web (Beddington 1995).
The ecosystem parameters measured and used as indicators of changing conditions in the productivity module are zooplankton biodiversity and species composition, zooplankton biomass, water-column structure, photosynthetically active radiation, transparency, chlorophyll-a, nitrate, and primary production. Plankton can be measured over decadal time scales by deploying continuous plankton recorder systems with sensors for temperature and salinity, in monthly transects across ecosystems from commercial vessels of opportunity (SAHFOS 2008). The Mariner Shuttle, an advanced plankton recorder, provides the means for in-situ monitoring and for calibrating satellite-derived oceanographic data. Properly calibrated sensors can provide information on ecosystem conditions including physical state (i.e., surface temperature), fast repetitious rate fluorescence chlorophyll characteristics, primary productivity, salinity, oxygen, nitrate, and zooplankton (Aiken et al. 1999; Berman and Sherman 2001; Melrose et al. 2006).
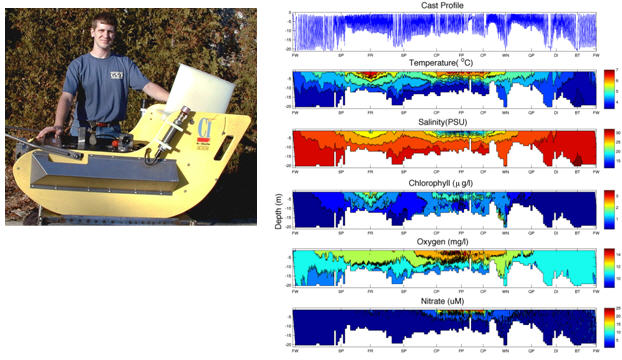
Figure 1. Mariner Shuttle undulating oceanographic sampling system (left) carries sensors for temperature, salinity, chlorophyll, oxygen and nitrate. Payload output (right) of depth, temperature, salinity, chlorophyll, oxygen, and nitrate. The Shuttle also carries a continuous plankton recorder mechanism.
Applications of multiannual satellite-derived time-series information on chlorophyll, primary production, sea surface temperature, and hydrographic gradients for the world's 64 LMEs are given in Sherman and Hempel (2008).
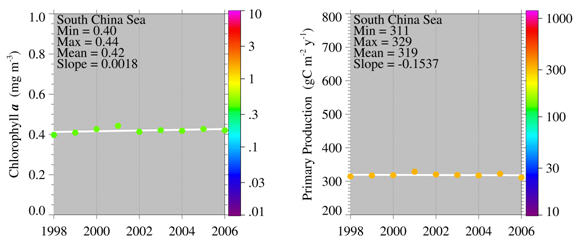
Figure 2. South China Sea LME trends in SeaWiFS-derived chlorophyll a (left) and primary productivity (right), 1998-2006. Values are colour coded to the right hand ordinate. Figure courtesy of J. O'Reilly and K. Hyde, NOAA-Fisheries, Narragansett Laboratory. Sources discussed p. 15, UNEP LME Report (Sherman and Hempel 2008) available from Reports on this website.
Selected Productivity Indicator Module publications
Aiken J, Pollard R, Williams R, Griffiths G, Bellan I. 1999. Measurements of the upper ocean structure using towed profiling systems. In: Sherman K, Tang Q, editors. Large marine ecosystems of the Pacific Rim: Assessment, sustainability, and management. Malden, MA: Blackwell Science, Inc. p 346-362.
Beddington JR. 1995. The primary requirements. Nature 374:213-214.
Berman MS, Sherman K. 2001. A towed body sampler for monitoring marine ecosystems. Sea Technology 42(9):48-52.
Melrose DC, Oviatt CA, O'Reilly JE, Berman MS. 2006. Comparisons of fast repetition rate fluorescence estimated primary production and 14C uptake by phytoplankton. Marine Ecology Progress Series 311:37-46.
Pauly D, Christensen V. 1995. Primary production required to sustain global fisheries. Nature 374:255-257.
SAHFOS. 2008. Annual Report 2007. Plymouth, UK: The Sir Alister Hardy Foundation for Ocean Science.
Sherman K, Hempel G, eds. 2008. The UNEP Large Marine Ecosystem Report: A perspective on changing conditions in LMEs of the world's Regional Seas, UNEP Regional Seas Report and Studies No. 182. Nairobi, Kenya: UNEP. 872 p.