|
Envisat imagery has not been utilized much within the Mekong Basin since the launch of the satellite in 2002. Recently acquired radar imagery from Envisats ASAR instrument suggests that it can be very valuable in a number of ways, including flood monitoring and wetland mapping.
ASAR represents the most recent generation of satellite radars. It is capable of transmitting and receiving microwave energy at different polarization stages to illuminate the Earths surface and capture the backscattered components of that energy. Different vegetation associations respond in different ways to the incident radar beams in their either horizontally or vertically polarized form. Therefore, one can expect to detect and identify these vegetation communities. The resulting picture is no longer simply a black & white image, but a multi-coloured rendition of the different polarization signatures.
The principal strategic advantage of the satellite radar is its reliability: imagery can be collected even under cloudy and rainy conditions, especially during the monsoon season. This affords scientists and resource managers the opportunity to observe and analyze dynamic environmental conditions associated with wetland ecosystems.
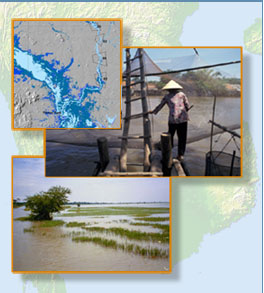
A preliminary assessment of an Envisat ASAR image of the Tonle Sap Mekong river flood plain shows promise for wetland mapping. This image was acquired on November 21, 2003, after the monsoon flood peak had passed, and when water levels had started to fall.
This image and its radar polarization related signatures show distinctions between at least seven different colours and associated land cover classes:
1. The dark blue tone corresponds to the main course of the rivers and a number of permanent (open water) lake surfaces.
2-4. The light purple, purple and blue areas are associated with wetland vegetation communities. The blue areas dominate along the fringes of larger water bodies; these are in all likelihood seasonal wetlands. Rice fields are also included in these colour categories.
5-6. The light to dark green areas correspond to woody vegetation, shrub and grasslands. The dark green areas dominate in the dry uplands, whereas the light green areas are more prominent in the wet lowland (flood plain) areas, including wooded levees along the rivers.
7. Light pink areas correspond, in part, to rural settlements with homestead forest and to urban areas.
This radar image represents only a single glimpse, or snapshot. Wetland ecosystem dynamics can be studied more fully by using a time series of imagery. This time series can be used to examine seasonal conditions, for example different flood stages, or flooded and non-flooded vegetation.
|

![water_riv_envisat_asar_th[1]](../assets/images/water_riv_envisat_asar_th_1_-2.jpg "water_riv_envisat_asar_th[1]")