Your query returned 200 graphics.
Results 16 - 30
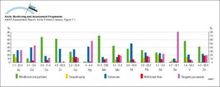
Global emissions of trace metals to the atmosphere from natural sources Numbers under the columns are the range of estimates of the emissions in thousands of tonnes per yearGlobal emissions of trace metals to the atmosphere from natural sources Numbers under the columns are the range of estimates of the emissions in thousands of tonnes per year |
|
Spatial distribution of emissions of Pb within the 150 km x 150 km EMEP grid system for the area north of latitude 50° N in 1989Spatial distribution of emissions of Pb within the 150 km x 150 km EMEP grid system for the area north of latitude 50° N in 1989 |

|
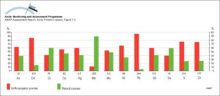
Comparison of global emissions of trace metals to the atmosphere from natural and anthropogenic sources in 1983 Numbers under the columns are the median values of estimates of total emissions in thousands of tonnes per yearComparison of global emissions of trace metals to the atmosphere from natural and anthropogenic sources in 1983 Numbers under the columns are the median values of estimates of total emissions in [..] |
|
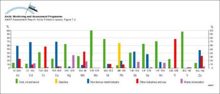
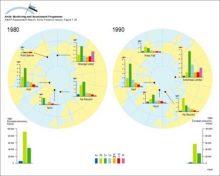
Global emissions of trace metals to the atmosphere at the beginning of the 1980s from anthropogenic sourcesGlobal emissions of trace metals to the atmosphere at the beginning of the 1980s from anthropogenic sources |
|
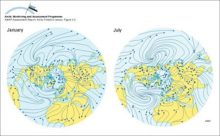
Arctic atmospheric circulationThe mean circulation of the lower atmosphere during January and July as depicted by mean streamlines of the resultant winds |
|
(a) Critical deposition of sulfur, and (b) its exceedance, in forest soils of northern Europe and Russia (5th percentile of the calculation points in each EMEP grid cell)(a) Critical deposition of sulfur, and (b) its exceedance, in forest soils of northern Europe and Russia (5th percentile of the calculation points in each EMEP grid cell) |

|
(a) Critical loads of acidity expressed as sulfur (5th percentile presented for each grid) for lakes in northern Fennoscandia and surface waters on Svalbard, and (b) their exceedance (95th percentile)(a) Critical loads of acidity expressed as sulfur (5th percentile presented for each grid) for lakes in northern Fennoscandia and surface waters on Svalbard, and (b) their exceedance (95th percentile) |

|
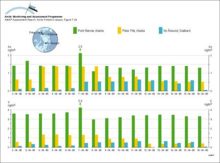
Average contributions from various sources to the atmospheric concentrations of elements in winter air samples at Ny-Ålesund, SvalbardAverage contributions from various sources to the atmospheric concentrations of elements in winter air samples at Ny-Ålesund, Svalbard |

|
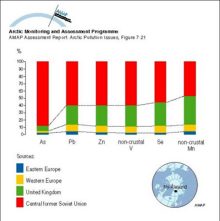
Average regional source apportionment of metals in winter aerosol at Ny-Ålesund, Svalbard from Europe and the central part of the former Soviet Union (including the Urals and Norilsk)Average regional source apportionment of metals in winter aerosol at Ny-Ålesund, Svalbard from Europe and the central part of the former Soviet Union (including the Urals and Norilsk) |
|
Atmospheric winter concentrations (median values) of metals measured in different years in the <25 µm aerosol fraction at Ny-Ålesund, SvalbardAtmospheric winter concentrations (median values) of metals measured in different years in the <25 µm aerosol fraction at Ny-Ålesund, Svalbard |
|
Composition of particles measured at different altitudes during winter flights in the Norwegian ArcticComposition of particles measured at different altitudes during winter flights in the Norwegian Arctic |

|
Concentrations of As and V in aerosols measured during concurrent measurement campaigns on Svalbard and two locations in Alaska during April 1986Concentrations of As and V in aerosols measured during concurrent measurement campaigns on Svalbard and two locations in Alaska during April 1986 |
|
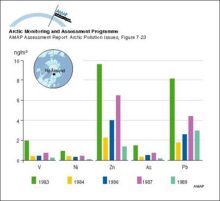
Winter concentrations of metals in air at remote locations in the Arctic at the beginning of the 1980s and 1990s, and European emissions of As, Pb and Zn during the same periodsWinter concentrations of metals in air at remote locations in the Arctic at the beginning of the 1980s and 1990s, and European emissions of As, Pb and Zn during the same periods |
|
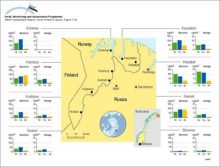
Average (15-month) and 24-h average maximum air concentrations of Ni, Cu and As measured at several stations in northern Norway near to major point sources on the Kola PeninsulaAverage (15-month) and 24-h average maximum air concentrations of Ni, Cu and As measured at several stations in northern Norway near to major point sources on the Kola Peninsula |
|
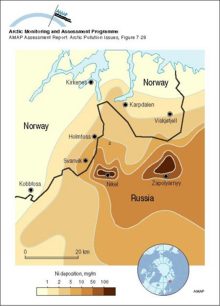
Nickel deposition to snow on the Kola Peninsula in April 1990Nickel deposition to snow on the Kola Peninsula in April 1990 |
|

water OR waste searches for either of these words
oceans AND biodiversity searches for blocks with both words
pollution NEAR water searches for blocks with either of these words, with them being closer ranks higher
"climate change" searches for this phrase