Your query returned 200 graphics.
Results 31 - 45
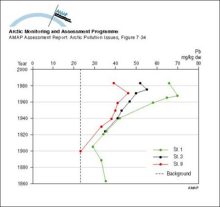
Lead in sediments near the cryolite mine at Ivittuut, south Greenland Stations 1, 3 and 9 are located at distances of 800 m, 1600 m and 5600 m, respectively, from the mineLead in sediments near the cryolite mine at Ivittuut, south Greenland Stations 1, 3 and 9 are located at distances of 800 m, 1600 m and 5600 m, respectively, from the mine |
|
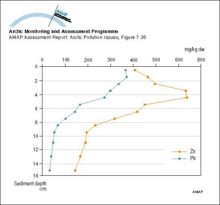
Lead and zinc in a sediment core sampled in 1991, 15 km from the Black Angel mine in West GreenlandLead and zinc in a sediment core sampled in 1991, 15 km from the Black Angel mine in West Greenland |
|
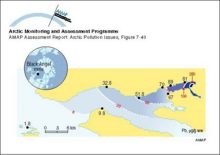
Lead levels in blue mussels (Mytilus edulis) in the fjord outside the Black Angel lead-zinc mine in West Greenland in 1986-87 Values on the fjord coast are measured concentrations Estimated concentrations in the fiord are indicated by isolinesLead levels in blue mussels (Mytilus edulis) in the fjord outside the Black Angel lead-zinc mine in West Greenland in 1986-87 Values on the fjord coast are measured concentrations Estimated [..] |
|
Temporal trend of Pb concentrations in growing tips of seaweed (Fucus vesiculosus) at the Black Angel lead-zinc mine in West Greenland The background value is estimated to be 02 µg/g dwTemporal trend of Pb concentrations in growing tips of seaweed (Fucus vesiculosus) at the Black Angel lead-zinc mine in West Greenland The background value is estimated to be 02 µg/g dw |

|
Temporal trend of Pb concentrations in liver tissue of spotted wolffish (Anarhichas minor) at the Black Angel lead-zinc mine in West GreenlandTemporal trend of Pb concentrations in liver tissue of spotted wolffish (Anarhichas minor) at the Black Angel lead-zinc mine in West Greenland |

|
Development of a type 1 ozone anomaly The series of satellite images show total column ozone for a period of days spanning 6-26 January 1996Development of a type 1 ozone anomaly The series of satellite images show total column ozone for a period of days spanning 6-26 January 1996 |

|
Trends in (annual average) ozone mixing ratio over Canada from 1980 to 1993Trends in (annual average) ozone mixing ratio over Canada from 1980 to 1993 |

|
Ozone soundings at Gardermoen, southern Norway, 27 January 1992 The green line denotes the partial pressure of ozone observed during the (type 1) anomaly, when low-ozone air passed over the areaOzone soundings at Gardermoen, southern Norway, 27 January 1992 The green line denotes the partial pressure of ozone observed during the (type 1) anomaly, when low-ozone air passed over the area |

|
An example of a type 2 ozone anomaly, showing levels of ozone depletion relative to the long-term meanAn example of a type 2 ozone anomaly, showing levels of ozone depletion relative to the long-term mean |

|
Ozone soundings at Sodankylä, Finland, 23 March 1995 The green line denotes the profile of partial pressure of ozone observed during the (type 2) anomaly The red line shows the monthly mean ozone profile for MarchOzone soundings at Sodankylä, Finland, 23 March 1995 The green line denotes the profile of partial pressure of ozone observed during the (type 2) anomaly The red line shows the monthly mean ozone [..] |

|
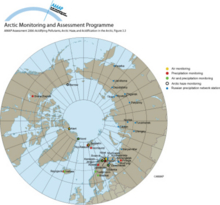
Locations of background monitoring stations for air and precipitation chemistryLocations of background monitoring stations for air and precipitation chemistry, and arctic haze and the Russian precipitation chemistry stations |
|
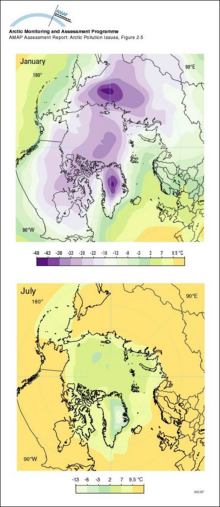
Arctic surface air temperatureMean January and July surface air temperatures (°C) in the Arctic |
|
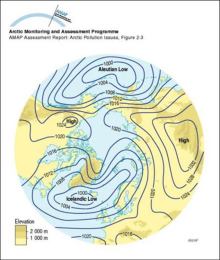
Arctic sea-level atmospheric pressure (January)Mean atmospheric sea-level pressure (mb) in the Arctic in January |
|
Global emissions of Pb to the atmosphere from various sources and source regions in 1989 Numbers under the columns are maximum estimates of the total emissions in tonnesGlobal emissions of Pb to the atmosphere from various sources and source regions in 1989 Numbers under the columns are maximum estimates of the total emissions in tonnes |

|
Spatial distribution of global emissions of Hg in 1990 within a 1° x 1° grid The total emission inventory is 2144 tonnes HgSpatial distribution of global emissions of Hg in 1990 within a 1° x 1° grid The total emission inventory is 2144 tonnes Hg |

|

water OR waste searches for either of these words
oceans AND biodiversity searches for blocks with both words
pollution NEAR water searches for blocks with either of these words, with them being closer ranks higher
"climate change" searches for this phrase