Your query returned 115 graphics.
Results 1 - 15
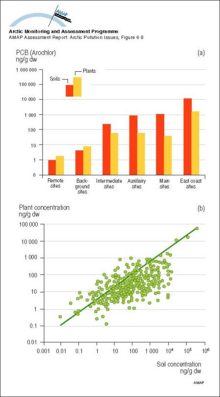
Concentrations of Aroclor PCBs in soils and plants (ng/g dw) associated with military radar sites in the Canadian Arctic a) Mean and maximum total PCB concentrations in soils and associated plants from remote (>20 km), backgroundConcentrations of Aroclor PCBs in soils and plants (ng/g dw) associated with military radar sites in the Canadian Arctic a) Mean and maximum total PCB concentrations in soils and associated plants [..] |
|
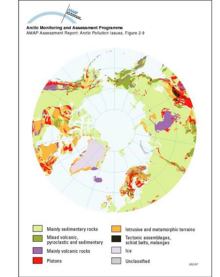
Arctic geologyBedrock geology of the Arctic |
|
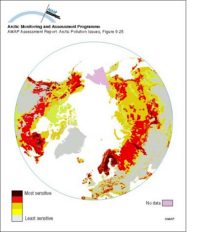
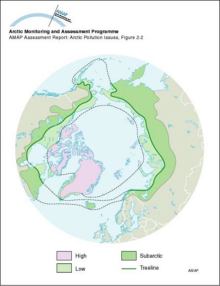
Sensitivity of Arctic ecosystems to acid depositionSensitivity of Arctic ecosystems to acid deposition |
|
(a) Critical deposition of sulfur, and (b) its exceedance, in forest soils of northern Europe and Russia (5th percentile of the calculation points in each EMEP grid cell)(a) Critical deposition of sulfur, and (b) its exceedance, in forest soils of northern Europe and Russia (5th percentile of the calculation points in each EMEP grid cell) |

|
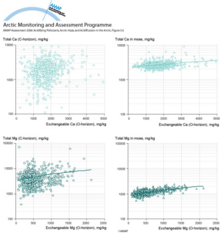
Ammonium acetate extractable Ca and Mg in the O-horizon of soilsAmmonium acetate extractable Ca and Mg in the O-horizon of soils (x-axis) vs. their total concentrations (aqua regia extractable) in the C-horizon of soils and in moss in 1995 |
|
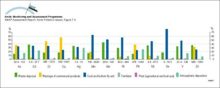
Global anthropogenic inputs of trace metals to soils at the beginning of the 1980s Numbers under the columns are the range of estimates of the inputs in thousands of tonnes per yearGlobal anthropogenic inputs of trace metals to soils at the beginning of the 1980s Numbers under the columns are the range of estimates of the inputs in thousands of tonnes per year |
|
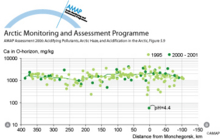
Transect west–east across the survey area showing exchangeable Ca in the O-horizon of podzol soils in 1995 and from 2000 to 2001Transect west–east across the survey area showing exchangeable Ca in the O-horizon of podzol soils in 1995 (Kola Ecogeochemistry Project) and from 2000 to 2001 (Barents Ecogeochemistry Project) |
|
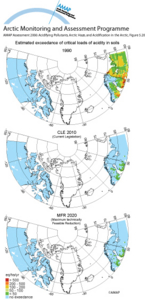
Estimated exceedance of critical loads of acidity for soils for three emission/deposition scenariosEstimated exceedance of critical loads of acidity for soils for three emission/deposition scenarios: 1990 emissions, the CLE scenario for 2010 (CLE, 2010), and the MFR scenario for 2020 (MFR, 2020). |
|
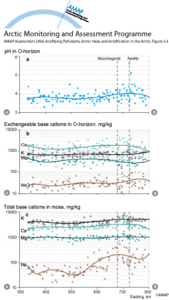
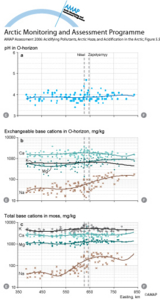
Transect west–east across the survey area and through the industrial zone centered on Monchegorsk and Apatity in 1995Transect west–east across the survey area and through the industrial zone centered on Monchegorsk and Apatity in 1995, showing: (a) pH in a water extract of the O-horizon of podzol soils; (b) [..] |
|
Transect west–east across the survey area and through the industrial zone centered on Nikel and Zapolyarnyy in 1995Transect west–east across the survey area and through the industrial zone centered on Nikel and Zapolyarnyy in 1995, showing (a) pH in a water extract of the O-horizon of podzol soils; (b) [..] |
|
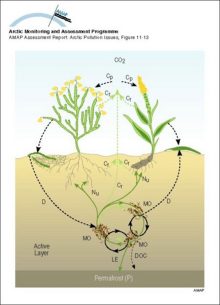
Schematic illustration of ecosystem carbon fluxes and nutrient circulation in the tundra Carbon and nutrient pathways are shown by dashed and continuous lines, respectivelySchematic illustration of ecosystem carbon fluxes and nutrient circulation in the tundra Carbon and nutrient pathways are shown by dashed and continuous lines, respectively |
|
Arctic boundaries (floristic)Arctic and subarctic floristic boundaries |
|
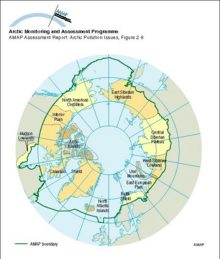
Arctic geologic and physiographic regionsGeologic and physiographic regions of the Arctic |
|
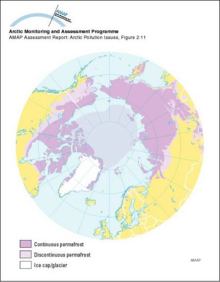
Circumpolar permafrost distributionCircumpolar permafrost distribution |
|
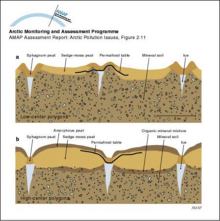
Polygon developmentLow-center and high-center polygon development |
|

water OR waste searches for either of these words
oceans AND biodiversity searches for blocks with both words
pollution NEAR water searches for blocks with either of these words, with them being closer ranks higher
"climate change" searches for this phrase