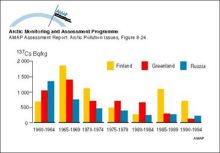
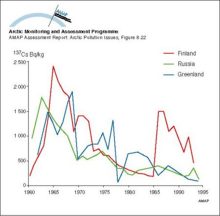
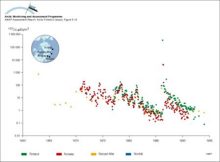
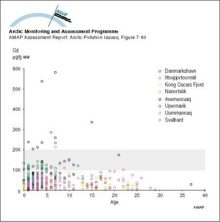
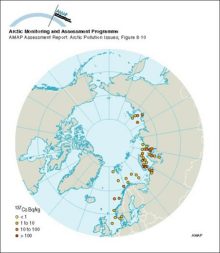
Changes with time in 137Cs activity concentrations (5-year means) in lichens in Arctic Finland, Greenland, and Russia

Changes with time in 137Cs activity concentrations (5-year means) in lichens in Arctic Finland, Greenland, and Russia

Changes with time in 137Cs activity concentration in lichen from Arctic Finland, north west Russia, and Greenland

Changes with time in 137Cs activity concentration in lichen from Arctic Finland, north west Russia, and Greenland

Changes with time in 137Cs activity concentration in air in Norway, Finland and Russia

Changes with time in 137Cs activity concentration in air in Norway, Finland and Russia

Cadmium levels in kidney of adult ringed seals from Greenland and Svalbard Levels associated with potential for kidney damage are above 100-200 µg/g ww

Cadmium levels in kidney of adult ringed seals from Greenland and Svalbard Levels associated with potential for kidney damage are above 100-200 µg/g ww

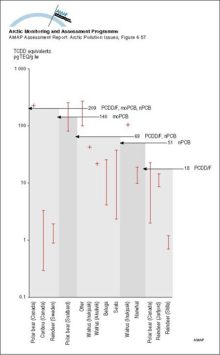
Body concentrations of PCDD/F and non-ortho and mono-ortho PCBs as TCDD equivalents (pg/g lw) in Arctic mammals compared to thresholds for immunosuppression in harbor seal for the same combinations of substances analyzed

Body concentrations of PCDD/F and non-ortho and mono-ortho PCBs as TCDD equivalents (pg/g lw) in Arctic mammals compared to thresholds for immunosuppression in harbor seal for the same combinations of [..]
Body concentrations of PCDD/F and non-ortho and mono-ortho PCBs as TCDD equivalents (pg/g lw) in Arctic mammals compared to thresholds for immunosuppression in harbor seal for the same combinations of substances analyzed

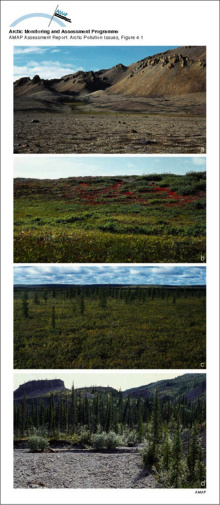
Biogeographical zones within the AMAP assessment area, a) High Arctic, b) Low Arctic, c) subarctic, and d) boreal forest

Biogeographical zones within the AMAP assessment area, a) High Arctic, b) Low Arctic, c) subarctic, and d) boreal forest

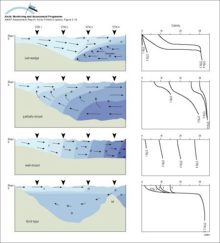
Basic circulation and salinity distribution in salt wedge, partially-mixed, well-mixed and fjord-type estuaries as defined by Wollast and Duinker (1982) Numbers and shading show salinity values

Basic circulation and salinity distribution in salt wedge, partially-mixed, well-mixed and fjord-type estuaries as defined by Wollast and Duinker (1982) Numbers and shading show salinity values

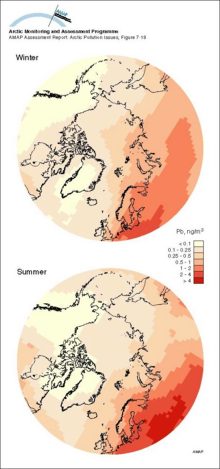
Averaged upper (3000 m) air concentrations of Pb in winter (December-February) and summer (June-August) as modeled by the updated (1996) hemispheric EMEP transport model in a simulation for the reference year 1988

Averaged upper (3000 m) air concentrations of Pb in winter (December-February) and summer (June-August) as modeled by the updated (1996) hemispheric EMEP transport model in a simulation for the [..]
Averaged upper (3000 m) air concentrations of Pb in winter (December-February) and summer (June-August) as modeled by the updated (1996) hemispheric EMEP transport model in a simulation for the reference year 1988

Average concentrations (ng/L) of sum-HCH in Arctic rivers in 1993

Average concentrations (ng/L) of sum-HCH in Arctic rivers in 1993

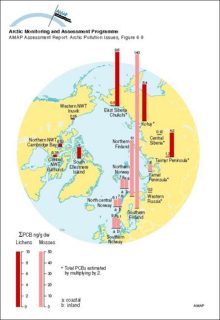
Average concentration (ng/g dw) of PCBs in Arctic lichen and mosses

Average concentration (ng/g dw) of PCBs in Arctic lichen and mosses

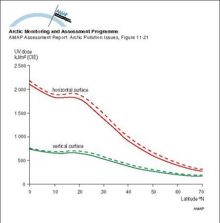
Average annual UV dose falling on vertical and horizontal surfaces as a function of latitude The solid lines represent the situation for the normal UV level with undisturbed ozone (prior to 1978)

Average annual UV dose falling on vertical and horizontal surfaces as a function of latitude The solid lines represent the situation for the normal UV level with undisturbed ozone (prior to 1978)

Average activity concentrations of 137Cs in reindeer meat after 1990

Average activity concentrations of 137Cs in reindeer meat after 1990

Average 137Cs activity concentrations in surface sediments of some Arctic seas sampled from 1992 to 1995

Average 137Cs activity concentrations in surface sediments of some Arctic seas sampled from 1992 to 1995

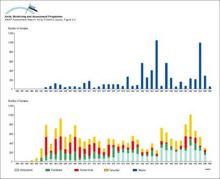
Available data in the AMAP radioactivity database as a function of time

Available data in the AMAP radioactivity database as a function of time

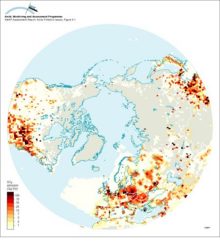
Anthropogenic SO2 emissions for 1985 north of 30°N

Anthropogenic SO2 emissions for 1985 north of 30°N


Related regions to search:
Number of graphics per country noted in paranthesis

Zoom out     Zoom in