|
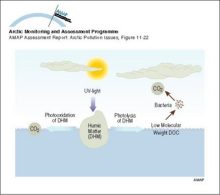
Illustration of the role of UV radiation in various light-dependent processes Natural UV radiation impacts the numbers, distribution and activity of several aquatic ecosystem targets and thus, [..]
|

|
|
Illustration of the role of UV radiation in the biogeochemical cycling of DOC
|
|
|
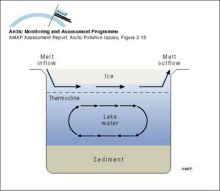
Illustration of the movement of less dense spring freshet water moving through a small Arctic lake underneath the surface ice cover, but not mixing with the water column
|
|
|
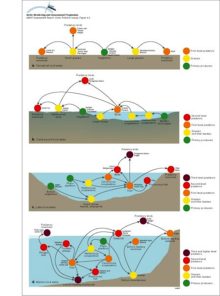
Illustration of the concept of a) the 'zone of influence' through major contaminant pathways from a major source region, and b) the 'contaminant focussing zone' resulting from the convergence of [..]
|

|
|
Historical profiles of PCBs (trichloro- and all other) in slices from dated sediment cores in Alaska, Canada, and Finland Median age of each slice is given on the vertical axis The green lines [..]
|

|
|
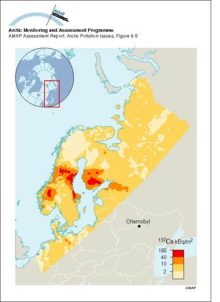
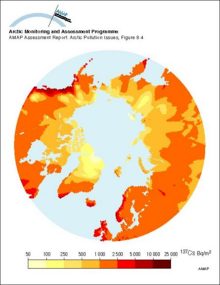
Ground deposition of 137Cs from the Chernoybl accident (values normalised to May 10, 1986)
|
|
|
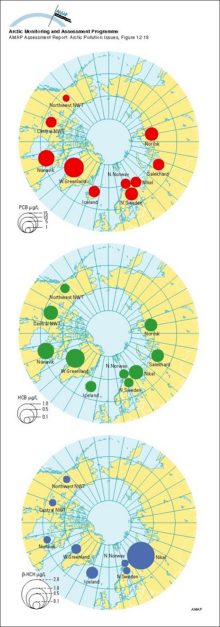
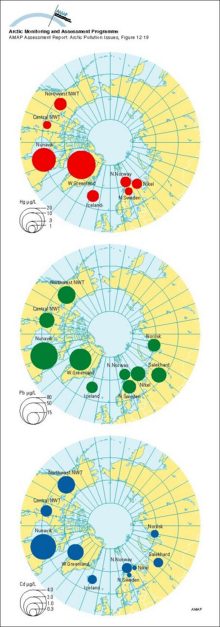
Geometric mean concentrations of PCB, HCB and B-HCH in maternal blood plasma; AMAP circumpolar study 1995, see Table 12A12
|
|
|
Geometric mean concentrations of mercury, lead and cadmium in maternal whole blood; AMAP circumpolar study 1994-95, see Table 12A13
|
|
|
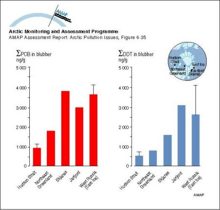
Geographical trends of PCB and DDT in harp seals from Arctic waters Vertical bars represent arithmetic means ± SD of combined results for males and females The SD has been estimated from the range in [..]
|
|
|
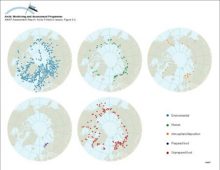
Geographical distribution of sample information in the AMAP radioactivity database
|
|
|
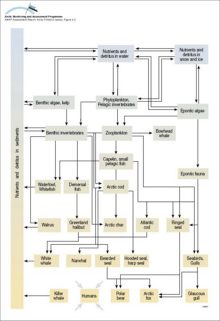
Generalized marine food web
|
|
|
Examples of Arctic food webs, a) terrestrial, b) tundra pond, c) lake, and d) marine
|
|
|
Estimated ground deposition of nuclear weapons fallout of 137Cs based on precipitation data, decay corrected to 1995
|
|
|
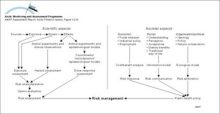
Elements involved in the evaluation and handling of risks from environmental contaminants
|
|
|
Distribution of potential temperature, salinity, and density across the Arctic Ocean and the Greenland and Norwegian Seas
|

|
