You are searching within the geographical region Arctic.
Other related regions to search.
Your query returned 359 graphics.
Results 256 - 270
Other related regions to search.
Your query returned 359 graphics.
Results 256 - 270
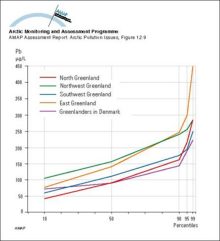
Distribution (in percentiles) of whole blood lead concentrations in four regions in Greenland and in Greenlanders living in DenmarkDistribution (in percentiles) of whole blood lead concentrations in four regions in Greenland and in Greenlanders living in Denmark |
|
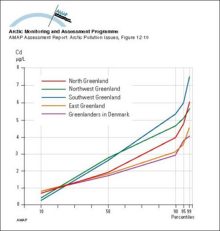
Distribution (in percentiles) of whole blood cadmium concentrations in four regions in Greenland and in Greenlanders living in DenmarkDistribution (in percentiles) of whole blood cadmium concentrations in four regions in Greenland and in Greenlanders living in Denmark |
|
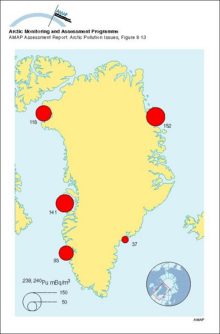
Concentrations of 239,240Pu in seawater around Greenland, 1968Concentrations of 239,240Pu in seawater around Greenland, 1968 |
|
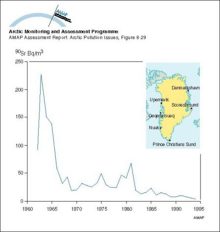
Changes with time in average activity concentration of 90Sr in drinking water in GreenlandChanges with time in average activity concentration of 90Sr in drinking water in Greenland |
|
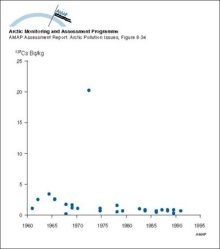
Changes with time in 137Cs activity concentration in whales from Greenland watersChanges with time in 137Cs activity concentration in whales from Greenland waters |
|
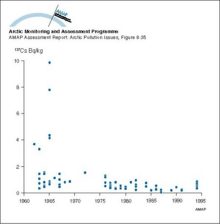
Changes with time in 137Cs activity concentration in seals from Greenland watersChanges with time in 137Cs activity concentration in seals from Greenland waters |
|
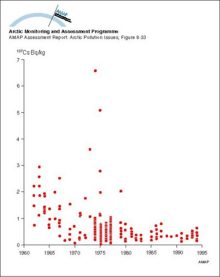
Changes with time in 137Cs activity concentration in marine fish from Greenland watersChanges with time in 137Cs activity concentration in marine fish from Greenland waters |
|
Calculated concentrations of SO2 and SO42- compared with measurements at Station Nord in northeastern GreenlandCalculated concentrations of SO2 and SO42- compared with measurements at Station Nord in northeastern Greenland |

|
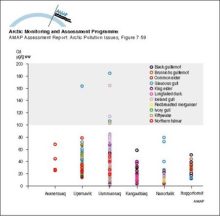
Cadmium levels in kidney of adult marine birds from Greenland Levels associated with potential for kidney damage are above 100 µg/g wwCadmium levels in kidney of adult marine birds from Greenland Levels associated with potential for kidney damage are above 100 µg/g ww |
|
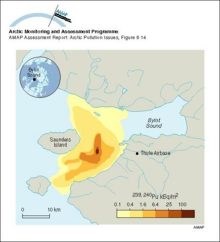
Activity concentrations of 239,240Pu in sediments near Thule, GreenlandActivity concentrations of 239,240Pu in sediments near Thule, Greenland |
|
Composition of particles measured at different altitudes during winter flights in the Norwegian ArcticComposition of particles measured at different altitudes during winter flights in the Norwegian Arctic |

|
Average regional source apportionment of metals in winter aerosol at Ny-Ålesund, Svalbard from Europe and the central part of the former Soviet Union (including the Urals and Norilsk)Average regional source apportionment of metals in winter aerosol at Ny-Ålesund, Svalbard from Europe and the central part of the former Soviet Union (including the Urals and Norilsk) |
|
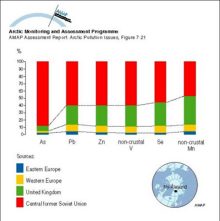
Average contributions from various sources to the atmospheric concentrations of elements in winter air samples at Ny-Ålesund, SvalbardAverage contributions from various sources to the atmospheric concentrations of elements in winter air samples at Ny-Ålesund, Svalbard |

|
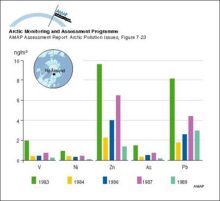
Atmospheric winter concentrations (median values) of metals measured in different years in the <25 µm aerosol fraction at Ny-Ålesund, SvalbardAtmospheric winter concentrations (median values) of metals measured in different years in the <25 µm aerosol fraction at Ny-Ålesund, Svalbard |
|
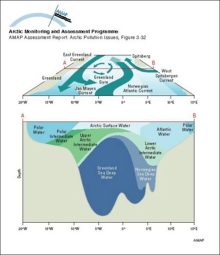
Schematic diagrams of the Greenland Sea showing the surface circulation (above) and water mass structure at a section across the central gyre (below)Schematic diagrams of the Greenland Sea showing the surface circulation (above) and water mass structure at a section across the central gyre (below) |
|
