|
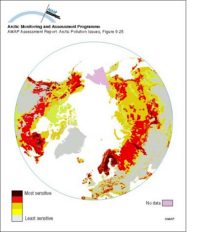
Sensitivity of Arctic ecosystems to acid deposition
|
|
|
Seawater concentrations of 137Cs in the Barents and East Greenland Seas compared to the yearly releases from Sellafield
|

|
|
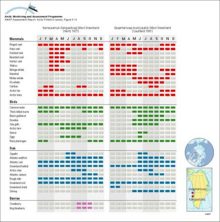
Seasonal resource utilization patterns, by month, for two communities in West Greenland
|
|
|
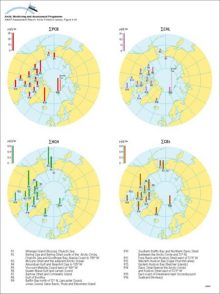
Seasonal and annual average surface temperature trends (°C per decade) over the northern hemisphere
|

|
|
Schematic representation of shelf processes involving transport of contaminants and sea ice
|

|
|
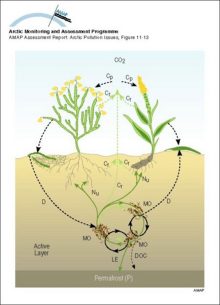
Schematic illustration of ecosystem carbon fluxes and nutrient circulation in the tundra Carbon and nutrient pathways are shown by dashed and continuous lines, respectively
|
|
|
Schematic diagram of the Combined Model Ten climatic zones, each containing well-mixed compartments, are connected by meridional atmospheric and oceanic exchange
|

|
|
Scatterplots for comparisons between the average concentrations of SO2 and SO4 in air from October 1990 to December 1993 as monitored by the European Monitoring and Evaluation Programme (EMEP) and [..]
|

|
|
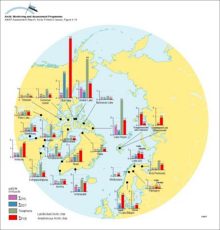
Ranges and average values of 137Cs activity concentrations in food products, from data in the AMAP radioactivity database
|

|
|
Photograph of a submarine being provided with cooling water from a supply ship
|
|
|
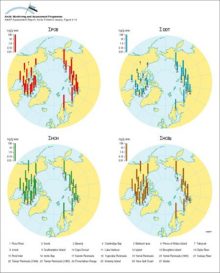
Organochlorine levels in polar bear adipose tissues (µg/g lw), adjusted to levels expected in 11-year-old males (after correction for age and sex), for sum-PCB, sum-CHL, sum-HCH, and sum-CBz, and in [..]
|
|
|
OC levels (µg/g lw in muscle) in landlocked and anadromous (italic labels) Arctic char
|
|
|
Observed and predicted organochlorine concentrations (ng/g ww) in caribou and reindeer (Rangifer tarandus) liver All data are presented in, or were derived from data in Annex Table 6A4
|
|
|
Monthly snow cover anomalies over northern hemispheric lands (including Greenland) between January 1972 and August 1995 Also shown are the 12-month running anomalies of hemispheric snow extent, [..]
|

|
|
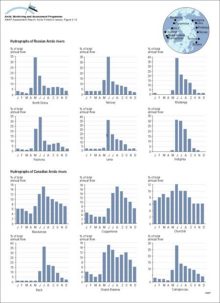
Monthly mean discharge expressed as a percent of annual discharge from available data for selected Russian and Canadian rivers draining to the Arctic
|
|
