


| PROGRAMMES | PROE | PUBLICATIONS, LIBRARY and IRC | SITE MAP | SPREP FORUMS | WEBMAIL - Global / Local | CONTACT | HOME
| Members | |
| > | Map |
| > | American Samoa |
| > | Australia |
| > | Cook Islands |
| > | Federated State of Micronesia |
| > | Fiji |
| > | France |
| > | French Polynesia |
| > | Guam |
| > | Kiribati |
| > | Marshall Islands |
| > | Nauru |
| > | New Caledonia |
| > | New Zealand |
| > | Niue |
| > | Northern Mariana Islands |
| > | Palau |
| > | Papua New Guinea |
| > | Samoa |
| > | Solomon Islands |
| > | Tokelau |
| > | Tonga |
| > | Tuvalu |
| > | United States of America |
| > | Vanuatu |
| > | Wallis and Futuna |
| Search |
SPREP Members
Member countries and country profiles
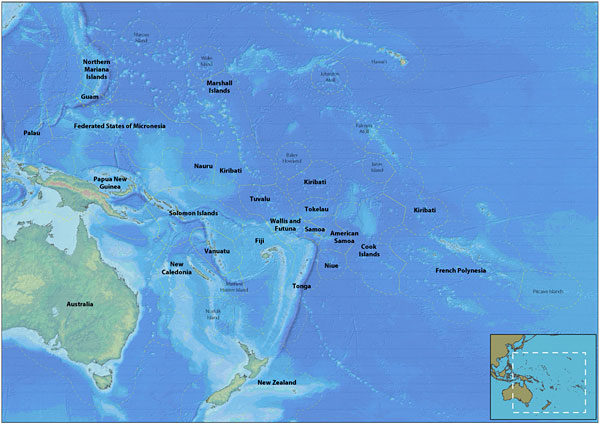
This map is indicative only of agreed and potential
maritime jurisdictional limits within the Central and South Pacific region.
It does not attempt to depict areas of jurisdiction beyond the 200 nautical
mile limit. It does not imply the expression of an opinion by SPREP on
the legality of any boundary shown and is without prejudice to negotiations
that countries may enter into. Map by SPREP Island Ecosystem Mapping/GIS.
Principal physical and economic features
(courtesy SPC, New Caledonia, see Selected Pacific Economies - Statistical Summary (SPESS))
For other Pacific statistics, see the Pacific Regional Information System (PRISM)
|
Country |
Land area (km 2 ) |
Sea area (EEZ) in thousands km 2 |
2000 population estimates |
Gross domestic product |
||||
Total |
Density
|
Annual growth rate (%) |
Total
|
Per capita ($US) |
Year |
|||
American Samoa |
200 |
390 |
64,100 |
321 |
2.9 |
437,900 |
6,995 |
2003e |
Cook Islands |
237 |
1,830 |
18,700 |
79 |
-0.5 |
182,175 |
8,553 |
2006* |
Federated States of Micronesia |
701 |
2,780 |
118,100 |
168 |
1.9 |
235,900 |
2,183 |
2007* |
Fiji Islands |
18,333 |
1,290 |
824,700 |
45 |
1.6 |
2,695,666 |
3,175 |
2006* |
French Polynesia |
3,521 |
5,030 |
233,000 |
66 |
1.6 |
5,640,452 |
22,472 |
2004 |
Guam |
541 |
218 |
148,200 |
274 |
1.0 |
3,700,000 |
22,661 |
2005 |
Kiribati |
811 |
3,550 |
90,700 |
112 |
2.5 |
61,433 |
653 |
2006* |
Marshall Islands |
181 |
2,131 |
51,700 |
286 |
2.0 |
149,219 |
2,851 |
2007 |
Nauru |
21 |
320 |
11,500 |
548 |
1.8 |
27,661 |
2,807 |
2005-2006 |
Niue |
259 |
390 |
1,900 |
7 |
-3.1 |
10,006 |
5,828 |
2003 |
New Caledonia |
18,576 |
1,740 |
212,700 |
11 |
1.8 |
7,129,631 |
29,898 |
2006e |
Northern Mariana Islands (CNMI) |
471 |
777 |
76,700 |
163 |
5.5 |
948,659 |
12,638 |
2005 |
Palau |
488 |
629 |
19,100 |
39 |
2.2 |
170,144 |
8,423 |
2007e |
Papua New Guinea |
462,243 |
3,120 |
4,790,800 |
10 |
2.3 |
6,044,220 |
991 |
2006 |
Samoa |
2,935 |
120 |
169,200 |
58 |
0.6 |
532,000 |
2,872 |
2007 |
Solomon Islands |
28,370 |
1,340 |
447,900 |
16 |
3.4 |
373,800 |
753 |
2006 |
Tokelau |
12 |
290 |
1,500 |
125 |
0.0 |
- |
- |
- |
Tonga |
649 |
700 |
100,200 |
154 |
0.6 |
234,484 |
2,319 |
2006 |
Tuvalu |
26 |
900 |
9,900 |
381 |
0.9 |
17,514 |
1,831 |
2002 |
Vanuatu |
12,190 |
680 |
199,800 |
16 |
3.0 |
459,010 |
2,127 |
2006 |
Wallis and Futuna |
255 |
300 |
14,400 |
56 |
0.5 |
- |
- |
- |
e - estimate; * - provisional
see also Pacific regional environment indicators [PRISM]
see also Environment
Statistics - Country Snapshots [UN; 2009]
American
Samoa, Cook
Islands, Federated
States of Micronesia, Fiji,
French
Polynesia, Guam,
Kiribati,
Marshall
Islands, Nauru,
Niue,
Northern
Mariana Islands, Palau,
Papua
New Guinea,
Samoa, Solomon
Islands, Tokelau,
Tonga, Tuvalu,
Vanuatu, Wallis
and Futuna.
see also Environmental Vulnerability Index - Country Profiles
[SOPAC / UNEP]
American
Samoa, Cook
Islands, Federated
States of Micronesia, Fiji,
French
Polynesia,
Kiribati, Marshall
Islands, Northern
Mariana Islands, Nauru,
New
Caledonia, Niue,
Palau,
Papua
New Guinea, Samoa,
Solomon Islands, Tokelau,
Tonga,
Tuvalu,
Vanuatu,
Wallis
and Futuna
see also Millenium
Development Goals Progress Reports
see also Millenium
Development Goals Environment Indicators
see also State
of the Environment of the Pacific 2005 [UNEP]