| |
Social and economic changes within the Black Sea Basin both impact the ecosystem and are impacted by many of the environmental changes that have been brought about during the last century. The historical socio-economic conditions of the Black Sea have largely shaped practices that continue to date. The shift from the Soviet economic system to a more free market system in the Warsaw Pact States, the movement towards EU accession of some countries, and economic fluctuations in the 1990s have influenced the ecosystem of the Black Sea.
The Black Sea countries coastal zones  are estimated to contain about 20 million people in their coastal areas. However, the situation with regard to Istanbul is confusing, since the coastal administrative unit which includes Istanbul has a short Black Sea coastline. Thus, if the population of this area is also included, the value increases to over 39 million people.
The proportion of national populations living within Black Sea coastal administrative areas varies widely: 0.6% in Russia, 4.5% in Romania, 10.5% in Turkey (excluding Istanbul), 14.4% in Ukraine, 26.5% in Bulgaria, 37.1% in Turkey (including Istanbul) and 38.6% in Georgia.
Available data suggest the proportions of populations living in coastal administrative areas which are connected to sewerage systems range from about 50-60% in Turkey (excluding Istanbul), where the hilly topography and scattered population characteristics limit the number of villages and towns that can be connected to sewer, through 76% in Russia, to >90% in Bulgaria, Georgia and Romania. (No information available for Ukraine). However, these stastics bear no relationship to the level of treatment that is applied to the wastewater produced. A coastal population of some 7 million inhabitants are connected to sewerage systems discharging directly into the Sea. |
|
The population growth statistics in Fig. 3.5 demonstrate that the populations of the countries of the Black Sea Basin are experiencing a negative growth rate, with the exception of Turkey. Even Turkey has shown a slowing growth rate since 1995. The years around 1998 and 1999 show a dramatic decline in Bulgaria, and Romania with a recovery in 2001 and 2002. Russia and Georgia both show increasing rates though the increase in Georgia slowed significantly in 1998. Trends in population growth rates generally reflect the overall optimism about social and economic development prospects, with people having more children as they feel more confident about economic development. However in many industrialized societies, a decline in population growth suggests that costs of living are increasing, and families are having fewer children in order to provide for those they have. The regional average (mean of all 6 countries regardless of total country population size) is low, although with the larger population in Russia and Turkey the overall rate may be slightly positive. Specific settlement patterns will be addressed below, as they pertain to urban populations as well as coastal growth rates.
|
Figure 3.5 Annual regional population growth statistics  |
Table 3.5 shows the total population of the Black Sea countries, and percent of the population under the age of 15, as well as the density of the populations. While Bulgaria, Georgia, Romania, Russia and Ukraine have youth populations commensurate with most industrial developed countries, Turkey’s large youthful population (as nearly one third of the total population) indicates that the country’s population is likely to continue to increase within the coming 20–40 years, putting additional pressures on natural resources.
The size of the urban population is increasing in all Black Sea countries (Fig. 3.6), and as many towns and cities are in coastal areas, this will continue to result in increased pressure on the Sea itself. It should be noted that the increase in Turkey is especially stark, giving Istanbul the status of a “coastal mega-city” with an estimated population of about 15 million people. As the populations in Turkey is expected to expand, it is likely that this will have further impacts on the Sea if more stringent management of marine/coastal resource uses and better control of pollutant emissions from land do not occur.
|
Figure 3.6 Regional urban population statistics  |
The impacts of these populations are felt through activities that affect the Black Sea, as they are also impacted by conditions of the Black Sea and the Black Sea basin. The economic indicators provide an overview of how these populations are impacting the ecosystem of the Black Sea.
|
| |
Economic development indicators for the region provide a sense of how anthropogenic activities are driving resource use and therefore impacting ecological conditions.
Gross national income (GNI) per capita, provides a comparable standardized measure of the changes in the economic conditions across the region (Fig. 3.7). There was a positive trend overall, although the 1997-1998 economic down turn which impacted Russia also had regional repercussions that slowed down growth. The current trend shows a positive increase which seems to portend well for populations the region as a whole.
|
Figure 3.7 Gross national income per capita , Atlas method |
While the economic measure of GNI per capita above appears to support significant economic growth in the region, this must also be compared to the rate of inflation as indicated through the Consumer Price Index (Fig. 3.8). This suggests that inflation throughout the region is a significant concern, which will have resounding impacts on government revenues. This is especially significant for Turkey where the cost of a market basket of goods has more than tripled since the year 2000. While Georgia and Ukraine have experienced much lower rates of inflation, their lower rate of GNI per capita suggests that the increases though slight are also impacting populations and government revenues. The challenges of inflation creates environmental impacts for the Black Sea as governments must adjust budgets and meet demands for services with less value in the collected revenues than originally intended, and therefore diminishing the available resources to dedicate to environmental protection measures.
|
Figure 3.8 Consumer price index  for Black Sea countries |
An overall decline in agricultural production has occurred in the region since 1994 (Fig. 3.9A). The most precipitous decrease has been in Georgia, with less severe decreases in other countries. On average, over the period shown, the importance of agriculture to the regional economy halved, with a similar, albeit less severe decline in the natural resource extraction and manufacturing industries (Fig. 3.9B), However, other sectors (notably the service industry) have increased their importance as contributors to regional GDP (Fig. 3.9C). Of all sectors, the services sector has the lowest direct environmental impact, though impacts occur indirectly through increase fuel consumption for transportation and energy. Nonetheless, this increase in the services sector suggests that the economies are shifting towards less intensive or impacting activities, and there should be an anticipated overall decline of ecological impacts in the region if this trend persists.
Data from World Bank Development Indicators database (http://www.worldbank.org) suggest that there has been either no change in the national areas of agricultural land, or only a minor decrease in agri-land area. This, however, could be misleading, since the classification of agricultural land used for this purpose includes that which is “temporarily” fallow. The reality is that land registered as being temporarily fallow could have been fallow for a long time. The same data source shows that a marginal decrease in inorganic fertilisers application rates occurred between 1994 and 2002, albeit with an upturn in the most recent years.
The value of livestock production has been fairly constant (Fig. 3.10), though a notable increase occurred in Georgia prior to 1998, while there was a decline in Russia and Ukraine during this period. However, after this period the slight upturn in production suggests that continuation of this trend may be expected.
(C) |
|
Figure 3.9 Regional trends in (A) agricultural  , (B) natural resource extraction and
manufacturing  , and (C) service sector  contributions to GDP (value added) |
A particularly important trend in the Black Sea region is the growth in international tourism, particularly since 2000 (Fig. 3.12). The lack of data for Russia prior to 2001 alters the regional mean, but the rise suggests that there is a continuing increase, though this is national level data. Both standard tourism and eco-tourism within the Black Sea have the potential to gain status.
By comparison, crop production index statistics have been more tumultuous (Fig. 3.11), with the disruptions of the 1998 economic downturn being evidenced in Russia, Bulgaria, Georgia and Ukraine. The Georgian rates remained suppressed, while the Romanian increased significantly since 2000. An upward trend in regional crop production since the late 1980s suggests that environmental impacts of the arable sector are likely to continue.
|
Figure 3.10 Regional livestock production index statistics
|
|
Figure 3.11 Regional crop production index statistics  |
|
Figure 3.12 Regional trends in international tourism expenditure  |
|
| |
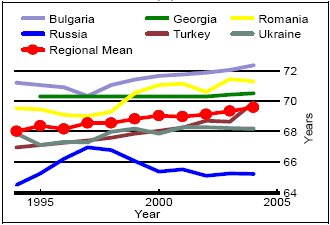
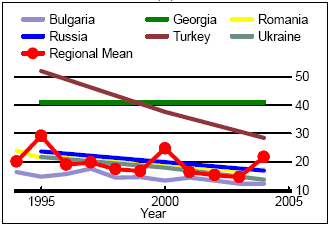
There has been a steady increase in human life expectancy in the region (Fig. 3.13) and a corresponding decrease in infant mortality, suggesting that overall health continues to improve. However, Russian life expectancy data took a downturn following the 1998 economic disruptions, which then leveled out, but still remains low. Infant mortality in Georgia remains higher than in other Black countries.
(A) |
(B) |
 |
 |
Figure 3.13 Regional trends in (A) life expectancy at birth  and (B) infant mortality
rates  |
The extent of basic education is a commonly accepted indicator of societal heath. Values of two indicators of this are shown in Fig. 3.14. It should be noted that in all cases the literacy rate is more than ten percent higher than it is for the US in the same time period. Thus, there is a regional norm of high literacy rates and relatively high primary completion rates. An interesting trend that could be inferred from this is the higher level of literacy rates among those over 15, compared to those in school currently. This suggests that there may be fewer students completing primary education now that during the soviet era. This trend is especially dominant in Georgia, Romania, and Ukraine.
|
Figure 3.14 Regıonal statistics on the level of education (2004)  |
|
|
|
|
|
|
