Spatial Distribution of the Winter Nutrient Pool
![]()
|
||||
Key message
![]() High levels of dissolved inorganic phosphorus remain in the surface waters of the Baltic Proper. This phosphorus has even spread into the Bothnian Sea.
High levels of dissolved inorganic phosphorus remain in the surface waters of the Baltic Proper. This phosphorus has even spread into the Bothnian Sea.
![]() Dissolved inorganic nitrogen levels remain below the 1993 – 2002 average in the offshore Baltic.
Dissolved inorganic nitrogen levels remain below the 1993 – 2002 average in the offshore Baltic.
Results and assessments
Relevance of the indicator for describing developments in the environment
Dissolved inorganic nutrients are essential for phytoplankton development. While rivers deliver phosphorus to the Baltic, most of this phosphorus is chemically bound to particles, and is not directly available for biological use. Some dissolved inogranic phosphorus (DIP) enters the Baltic with inflows of salt water, but the most significant source at present appears to be that released from bottom sediments during periods of anoxia. Deep water DIP can become bio-available if it is transported to the surface waters, but this transport is hampered by the permanent stratification. After the inflows of winter 2002 – 3, phosphorus concentrations in the surface water of the Baltic Proper increased significantly, and concentrations remain high today. The Baltic Sea Action Plan requires countries around the Baltic to reduce discharges of phosphorus to the marine environment.
Dissolved Inorganic Nitrogen (DIN) is composed of nitrate, nitrite and ammonium compounds, which are also required by phytoplankton. While DIN concentrations are much higher than DIP in surface waters, marine phytoplankton require 15 - 16 times as much DIN as DIP, often causing a lack of DIN to limit phytoplankton activity. Where DIN is used up, those bacteria that can fix nitrogen from the air can still flourish, making use of the remaining DIP, and causing blooms. Cyanobacteria have this ability, and so flourish in the Baltic. Nitrogen is cycled within the water column and sediment, while ‘fresh’ nitrogen is also supplied, directly or via rivers, by agricultural run-off and sewage discharges, and also through atmospheric deposition. The Baltic Sea Action Plan requires countries around the Baltic to reduce discharge of nitrogen to the marine environment.
Silicate is supplied to the Baltic via rivers, as a result of weathering processes. It is recycled in the marine system. An excess of silicate is typical of the Baltic, because of the large supply of river water, and the high concentrations present in the deep anoxic water. Excess silicate is not considered problematic in the Baltic.
Eutrophication is the supply of excessive amounts of nutrients. The spatial distribution of the primary bio-available nutrients (surface waters, during winter) highlights problem areas, and shows the availability of nutrients for the spring bloom. Changes in the spatial distribution may indicate changes in the hydrography, or the effect of remedial works. Mapping the excess winter:DIP may serve as a warning for areas where cyanobacteria blooms are likely. Some cyanobacteria are toxic.
Policy relevance and policy references
The Helcom COMBINE programme uses nutrient data to help quantify the effects of anthropogenic activities. This Indicator Report contributes to the programme’s requirement for information on:
- the winter pool of nutrients
- the supply of nutrients and nutrient limitation in coastal waters
Assessment
Concentrations of DIN are highest in coastal waters from the southern Belt Sea to the inner Gulf of Finland. Levels are also high in the Bothnian Bay. This is unsurprising as the major source of DIN to the Baltic is land run-off. Variability in winter DIN (indicated by the standard deviation plot in Figure 1) is generally due to variability in the land run-off, so is highest near sources of DIN.
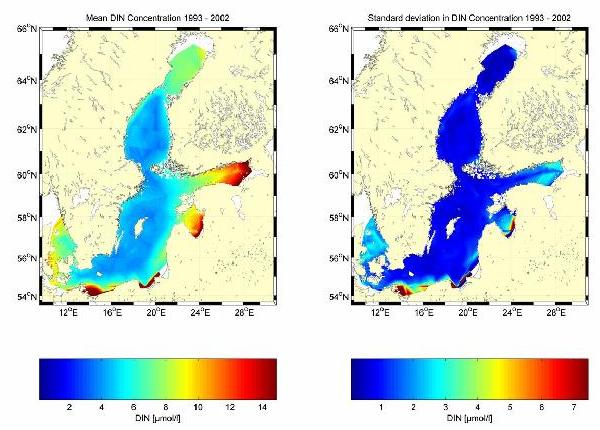
Figure 1. Mean winter surface DIN (left) and standard deviation (right) based on each year’s gridded winter surface observations from 1993 - 2002 inclusive. Surface refers to the upper 0 - 10 m. Units are micro-moles/litre. Click image to enlarge.
The highest DIP concentrations are usually also found in the Belt Sea, the southern Baltic coast and the inner Gulf of Finland, though levels are also significant along the Swedish east coast and in the Kattegat. Lowest levels are found offshore, in particular in the Gulf of Bothnia. This is because while some DIP originates from land sources, a large reservoir also exists in the deep water of the Baltic, which can come to the surface during upwelling events.
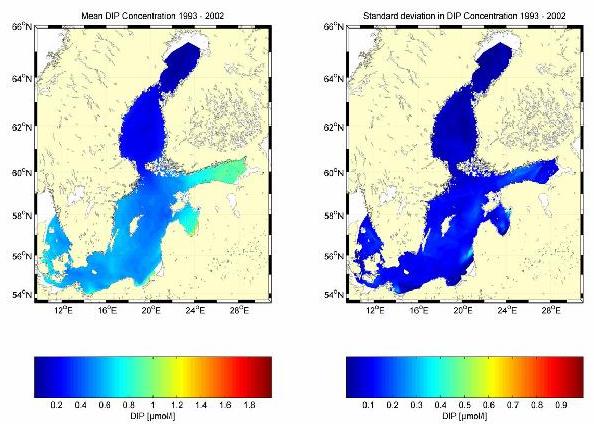
Figure 2. Mean winter surface DIP (left) and standard deviation (right) based on each year’s gridded winter surface observations from 1993 - 2002. Units are micromoles/litre. Click image to enlarge.
Highest silicate concentrations are found in the Bothnian Bay. The great rivers surrounding this bay transport large amounts of silicate released through natural processes.
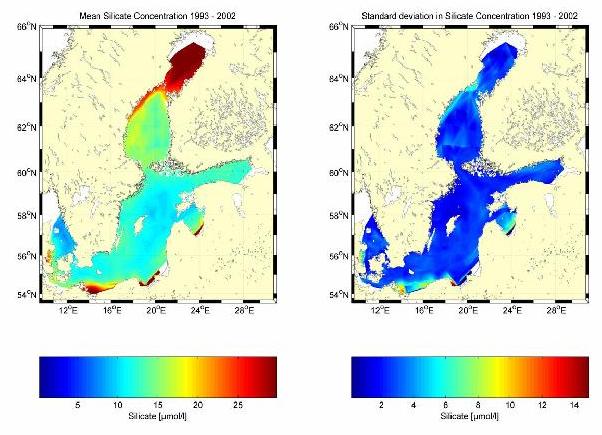
Figure 3. Mean winter surface silicate concentrations (left) and variability (right) based on each year's gridded HELCOM/ICES observations from 1993 - 2002. Units are micro-moles per litre. Click image to enlarge.
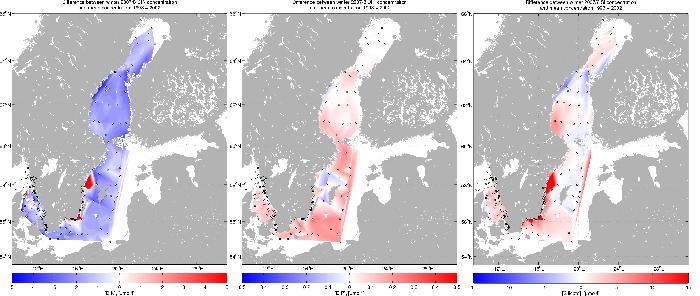
Figure 4. Difference between winter 2006-7 nutrient concentrations (DIN: left; DIP: centre; Silicate: right), and the 1993-2002 means. Click image to enlarge.
DIN concentrations remain below the 1993 - 2002 average, except for some coastal hotspots along the south eastern coast of Sweden, and in the northern Kattegat. Recent data from the eastern Baltic have not been available for this assessment. Levels close to normal were found in the centres of the Bornholm Basin, south eastern Baltic Proper and Northern Baltic Proper. The low offshore concentrations are similar to what has been observed in previous years, and may be attributable to reductions in nutrient inputs during the 1990’s. The higher coastal concentrations in the Kattegat and southern Swedish coastal waters may be due to local high rainfall during the 2007-8 (see Run-off fact sheet).
DIP concentrations remain high in almost all of the Baltic Proper and even in the Bothnian Sea. The natural Baltic outflow through the Sound and Belt Sea has led to higher DIP levels even in the Kattegat. DIP concentrations in the Bothnian Bay were back to normal after the previous winter's (2006 - 7) higher concentrations. In the central Bothnian Sea levels are now above average. North west of Gotland, there were lower than normal DIP concentrations. Why this region should not exhibit the same high concentrations as others is not yet clear.
Silicate levels remain higher than the 1993 – 2002 mean in the Bothnian Bay, southern Bothnian Sea, in the western Gotland Basin, southern Baltic Proper amd Kattegat. High concentrations along the south eastern coast of Sweden are most likely due to high run-off events (particularly when considered in relation to the high DIN concentrations). In the Gulf of Bothnia, high concentrations may also be due to run-off, while in the southern Baltic Proper, upwelling along the Swedish coast may contribute.
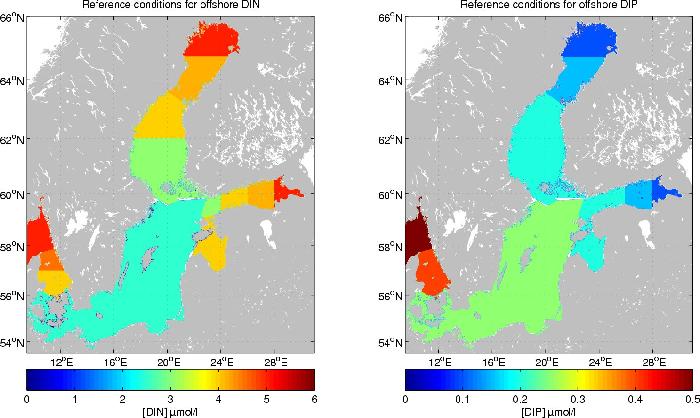
Figure 5. Reference concentrations of DIN and DIP in the Baltic basins, based on Swedish estimates developed during the implementation of the Water Framework Directive. Reference concentrations in the Gulf of Finland and Gulf of Riga have been based on those determined for the Gulf of Bothnia. Data source: Naturvårdsverket, 2007
In order to determine the environmental status of the Baltic, ecological quality targets have been derived. Figure 5 shows the inorganic nutrient concentrations considered to represent pristine status in the Baltic. Using these values, it is possible to estimate the ecological quality of the Baltic nutrient status. This is shown in Figure 6.
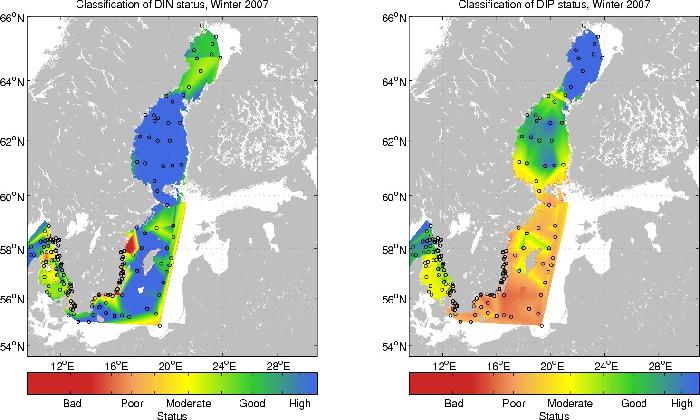
Figure 6. Ecological quality assessment of the winter nutrient concentrations in the Baltic, based on reference conditions from Figure 5.
Based on these reference conditions, it appears that status for DIN is generally "good" or "high" in the offshore Baltic Proper, the and Gulf of Bothnia. Even some areas of the Kattegat reach "Good" status. In Swedish coastal waters however, status quickly worsens. The high DIP concentrations in the Baltic Proper and southern Gulf of Bothnia are reflected in the DIP status classification, which does not get better than "moderate" in these areas. Status is almost acceptable north of Gotland, in the Skagerrak, and in the northern Gulf of Bothnia (offshore Bothnian Sea and Bothnian Bay).
This assessment is based on a national estimate of reference conditions, so should be considered preliminary. In particular, the high status of offshore DIN is surprising, and may be a reflection of too low reference conditions. The DIP assessment seems reasonable.
References
Helcom COMBINE Manual (Annex C), http://www.helcom.fi/Monas/CombineManual2/CombineHome.htm, December 2003. Data This study used data collected under the HELCOM COMBINE programme, and archived for HELCOM by ICES (http://www.ices.dk), supplemented with data collected by SMHI 2007/8.
Naturvårdsverket, 2007, "Bedömningsgrunder för kustvatten och vatten i övergångszon, Bilaga B", Bilaga till Naturvårdsverket Handbok 2007:4. http://www.naturvardsverket.se/Documents/publikationer/620-0149-0.pdf
For reference purposes, please cite this indicator fact sheet as follows:
[Author’s name(s)], [Year]. [Indicator Fact Sheet title]. HELCOM Indicator Fact Sheets 2008. Online. [Date Viewed], http://www.helcom.fi/environment2/ifs/en_GB/cover/.
Last updated: 4 November 2008
