Cyanobacterial blooms in the Baltic Sea
|
||||
Key Message
During 2008 cyanobacterial blooms in the Baltic Proper were concentrated to the month of July, whereas blooms in the Bothnian Sea continued to the end of August. The first extensive surface accumulations were observed in the southern half of the Baltic Proper on 2nd July. The bloom culminated during the warm and sunny period: 24 July to 1 August, when the satellite images revealed almost the entire Baltic Sea to be coloured green. The normalized bloom indexes for bloom extent, duration and intensity were all lower than the means for the period 1997-2007.
Results and Assessment
Relevance of the indicator for describing developments in the environment
Nitrogen fixation by cyanobacteria is a significant source of nitrogen to the Baltic Sea.
The amount of available phosphate in the surface water and weather conditions during the summer are important factors regulating the intensity of cyanobacterial blooms in the Baltic Sea. During 2008 phosphate concentrations were back to normal in the Baltic Proper with the exception of elevated concentrations in the Arkona and Bornholm Basin. (SMHI, R/V Argos cruise report, 18th-23rd August, 2008)
Weather conditions in the Baltic region during the summer 2008 were variable. Favorable weather conditions for cyanobacterial blooms prevailed during early and late July while August was dominated by unstable weather.
To be able to compare blooms between different years, the definitions of bloom normalized duration (T), extent (A) and intensity (I) have been developed. Based on the annual summaries (see example in figure 1) where the area (ai) is equal to the extent that is covered by surface accumulations of blooms during (i) number of days, the normalized duration and extent is given, with (i) ranging from 1 to the maximum number of days with bloom observations during the current year. The intensity is given in “extent days” or km2days. (Hansson, 2006 & Hansson & Håkansson, 2007)

Assessment
Faint signs of cyanobacteria at the water surface could be seen in the southernmost part of the Baltic Proper in June. On 2nd July the sky was clear over the southern half of the Baltic proper. This revealed a large coherent surface accumulation that was even more pronounced the next day. The samples from research vessel Argos on 7th-12th July showed Aphanizomenon sp. and Anabaena sp. dominating in the southwest while Nodularia sp. was most common in the eastern part of the Baltic Proper. During the following three weeks, most of the sea surface was hidden under dense clouds. The few gaps between the clouds now offered only a very scattered view of the algal bloom. The 23rd July, however, saw the onset of a week of calm and clear weather.
The next day, 24th July and until 1st August, almost the entire Baltic Proper and the southern half of the Bothnian Sea were covered with surface accumulations of cyanobacteria. The strongest accumulations were found east of Gotland and southeast of Öland. The satellite image from the 31st July show mostly dense accumulations from Bornholm in the southwest up to 62 °N in the Bothnian Sea including the western half of the Gulf of Finland. The R/V Argos cruise in the Baltic Proper in the last days of July confirmed the satellite observations. At time of writing, the samples from the expedition 28th July-2nd August have not been identified to species level.
On 2nd August the weather situation turned and the sunshine disappeared. The dense blooms were probably dispersed below the clouds from wind and wave action. The last accurate observation from the Baltic Proper was made on 6th August. The surface accumulations in the Bothnian Sea remained another couple of weeks, but became more and more faint and hade completely disappeared by the end of August.
The maximal extent (~180 000 km2) was observed on the 31st July when almost the entire Baltic Proper and parts of the Bothnian Sea and Gulf of Finland were covered by surface accumulations. The cloud cover during mid July and August were frequent and the area covered with clouds was only below 50% during early July and between 23rd July and 1st August.
The normalized bloom indexes for bloom extent (6675 km2), duration (4.9 days) and intensity 32651 km2days) were all lower than the means for the period 1997-2007.
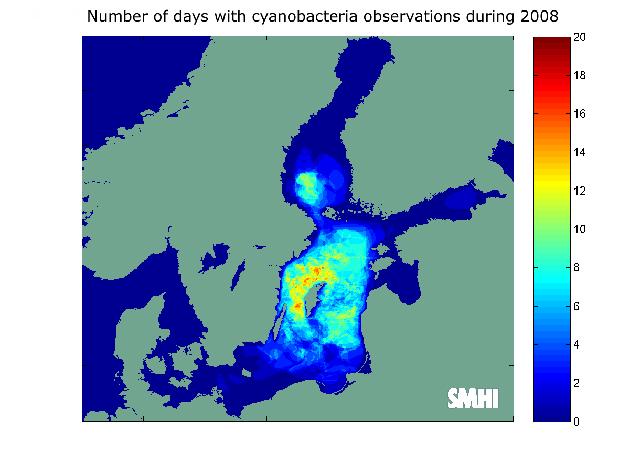
Figure 1. Number of days during 2008 with surface accumulations of cyanobacteria observed in each pixel based on NOAA-AVHRR satellite imagery.
Figure 2. Daily extent of surface accumulations of cyanobacteria in the Baltic Sea during 2008, observed by NOAA-AVHRR satellite imagery. Red bars correspond to definite bloom observations and yellow bars indicate uncertain bloom observations. The blue line represents the integrated cloud cover (in percent of the total area) over the whole analyzed area.

Figure 3. Summary of number of days with cyanobacterial observed in each pixel during the period 1997-2008, based on NOAA-AVHRR satellite imagery. Year 2001 is missing due to antenna malfunction at the receiving station.
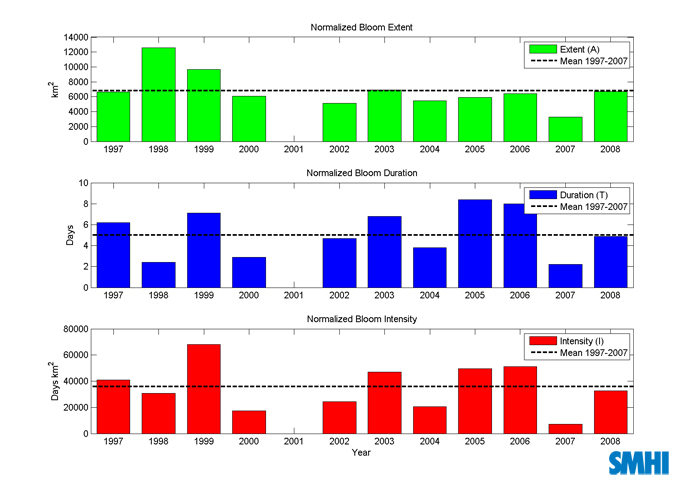
Figure 4. Presents a comparison of normalized extent, duration and intensity of cyanobacterial blooms betweem the period 1997-2008. The results are based on the yearly summaries. Note that presented data is normalized. See definition of normalized extent, duration and intensity above.
Reference
Hansson, M., & B. Hakansson, 2007, "The Baltic Algae Watch System - a remote sensing application for monitoring cyanobacterial blooms in the Baltic Sea", Journal of Applied Remote Sensing 2007, 1(1):011507.
Hansson, M. Cyanobakterieblomningar i Östersjön, resultat från satellitövervakning 1997-2005, SMHI Oceanografirapport nr 82, 2006, ISSN: 0283-7714.
Karhu, M., O.P. Savchuk, and R. Elmgren, 2007, “Satellite measurements of cyanobacterial bloom frequency in the Baltic Sea: Interannual and spatial variability”. In Press.Kahru, M., 1997, Using Satellites to Monitor Large-Scale Environmental Change: A case study of the Cyanobacteria Blooms in the Baltic Sea. Monitoring algal blooms: New techniques for detecting large-scale environmental change. Landes Bioscience.
Kahru, M., U. Horstmann and O. Rud, 1994, Satellite Detection of Increased Cyanobacteria Blooms in the Baltic Sea: Natural Fluctuation or Ecosystem change?, Ambio Vol. 23 No. 8.
Larsson, U., and L. Andersson, 2005, Varför ökar inte kvävet när fosforn ökar?, Miljötillståndet i Egentliga Östersjön, rapport 2005, Stockholms marina forskningscentrum.
SMHI, R/V Argos cruise reports & AlgAware, archive 2008.
http://www.smhi.se/cmp/jsp/polopoly.jsp?d=7732&l=sv
Data
The SMHI satellite receiving station in Norrköping collected the NOAA-AVHRR data.
Interpreted satellite images showing the extent of surface accumulations of bloom in the Baltic Sea is presented at the following website. The images are updated on a daily basis during summer.
http://www.smhi.se/weather/baws_ext/balt/BAWSStartDag_en.htm
Metadata
Technical information
1. Data source: The AVHRR-data from NOAA-satellites was received with the antenna at SMHI headquarters, Norrköping.
2. Description of data: The AVHRR-sensor measures radiation in 5 broad wavelength bands ranging from visible to thermal infrared.
3. Geographical coverage: The satellite monitoring of cyanobacteria has many advantages compared to regular vessel based monitoring. The NOAA-AVHRR has a wide swath width (~2600km), hence the entire Baltic region are covered. An exception is near all land areas such as within archipelagos. These cannot be monitored due to the coarse pixel resolution (~1km). Since 2006 a new geographical coverage has been introduced covering the whole Baltic region.
4. Temporal coverage: Data from the NOAA-AVHRR sensor have been available since the late 1970s. Karhu et al. (1994;1997) has produced a compiled time series of satellite data for analysis of cyanobacterial blooms in the Baltic Sea from 1982 to 1994. In 2002, SMHI initiated Baltic Algal Watch System (BAWS) that performs daily interpretations of satellite imagery during the summer. AVHRR data have also been analyzed between 1997 and 2000 by SMHI in the EU-project HABES (Harmful Algal Blooms Expert System).
5. Methodology and frequency of data collection: Satellite imagery is analyzed using both automatic cloud masks (O&SI-SAF) and manual interpretations. NOAA satellites have a repeat cycle of ~0.5 days and since there are several NOAA satellites mounted with the AVHRR sensor there can be ~12 overpasses per day. Between 0-6 overpasses are unsuitable for further analysis due to low viewing angles, sun glint, clouds or haze. The best viewing conditions are usually encountered during the morning.
6. Methodology of data manipulation: Data were calibrated to albedo for visible and near infrared channels, and to brightness temperature for the thermal channels. Data were also geographically corrected to an equal area projection.
Quality information1. Strength and weakness: Satellite data have high sampling frequency and allow a synoptic view. However, monitoring is limited to open sea areas due to the coarse pixel size, and is also limited by cloud cover.
2. Reliability, accuracy, robustness, and uncertainty: The AVHRR satellite can only be used for monitoring of meso-scale, surface accumulations of cyanobacteria. Algae can be found further down the water column. These are impossible to detect with satellite imagery. Therefore satellite data must be complemented by shipborne measurements, for example by data from SMHI:s offshore sampling program or Alg@line. Uncertain bloom observations are always noted and reanalyzed when more satellite scenes are available.
Satellite data from the medium-resolution channels of MODIS (Moderate Resolution Imaging Spectroradiometer) flown on the TERRA and AQUA satellites and MERIS (MEdium Resolution Imaging Spectrometer Instrument) flown on ENVISAT were used when good imagery was available to re-analyse the algal maps derived from the NOAA-AVHRR data. Manual corrections were performed if needed.
3. Further work required: Establishing a method to use different data from different sensors to detect cyanobacterial blooms and to make use of drift models to forecast the movements of blooms.
For reference purposes, please cite this indicator fact sheet as follows:
[Author’s name(s)], [Year]. [Indicator Fact Sheet title]. HELCOM Indicator Fact Sheets 2008. Online. [Date Viewed], http://www.helcom.fi/environment2/ifs/en_GB/cover/.
Last updated: 13 October 2008
