Chlorophyll-a concentrations, temporal variations and regional differences from satellite remote sensing
|
|||
Key Message
High spatial and temporal variability of satellite-derived chlorophyll, reaching maximum values in the summer, particularly in the central eastern and southeastern regions;
Significant regional differences in summer chlorophyll between the northern Baltic Sea chlorophyll (1-2 mg.m-3 on avg.), and the central-south part of the Baltic (5-6 mg.m-3 on avg.);
Disregarding potential differences between both sensors used (SeaWiFS and MODIS), no obvious trend over the 9-years time series is observed in summer chlorophyll concentrations;
Inter-annual variability of summer chlorophyll is particularly high in the Baltic Proper, Gulf of Finland and Gulf of Gdansk.
Relevance of the indicator for describing developments in the environment
A key ecological property of the marine and coastal environment monitored through Ocean Colour Radiometry (OCR) is the concentration of chlorophyll, commonly used as an index of phytoplankton biomass. In aquatic systems, phytoplankton biomass is primarily responsible for the transformation of carbon dioxide into organic carbon, sustaining the growth of all other organisms in the ecosystem. Ocean colour quantifies the base of the entire marine food chain. As such, information derived from ocean colour has made important contributions to marine physics and biogeochemistry, coastal dynamics, fisheries and coastal management.
By the nature of the technology, a satellite-derived assessment is basin-wide in scope. Ocean colour is our only window into the marine ecosystem on these scales. The value of the indicator lies also in the long-term monitoring guaranteed by the timelines of current and future satellite progranmmes. Such long time-series is of high relevance to analyze the response of the marine system to anthropogenic pressures like agriculture, urban development, fisheries, as well as climate change impacts.
In many regional seas ecosystems, a considerable increase in the concentration of nutrients in coastal waters has been recorded in the last decades. A main source of these nutrients is agriculture and intensive livestock- farming releasing mineral and organic compounds in the drainage basin. Subsequent nutrient enrichment of the coastal waters stimulates the growth of phytoplankton, leading, occasionally, to massive algal blooms and anoxia in the lower part of the water column with further destruction of the benthic fauna and flora. In addition, insufficient and selective sewage treatment can increase the amount of chemicals into the marine waters and modify the relative proportion of nutrients in the medium which could trigger brutal shift in the community species. These changes in ‘water quality’ can occur over a wide range of spatial and temporal scales. The traditional approach to use in situ techniques to assess the ecological state of marine and coastal waters, although extremely valuable, can rarely sustain the repeat frequency and spatial coverage that is required to support effective management practices in vulnerable areas where more intensive monitoring needs to be put in place.
Long-term monitoring capabilities of ocean colour radiometry from space can complement the field observations and contribute to:
better understand the functioning of the marine ecosystems
verify the success of implementing environmental legislation, e.g. the Water Framework Directive, the Nitrate Directive, the Urban Wastewater Treatment Directive, and the up-coming Marine Strategy Framework Directive.
Results and Assessment
In this document, the maps are produced from SeaWiFS (1998-2004; fig.1) and MODIS-Aqua (2002-2007; fig.2) satellite images showing the July-August mean concentration of chlorophyll pigments in the Baltic Sea. The overlapping years (2002-2004) indicate clear differences in the magnitude of chlorophyll concentrations between both sensors with a tendency for MODIS to retrieve higher values in regions of high summer concentrations (Baltic Proper, Gulf of Finland), and lower or similar values in regions of lower summer concentrations (Bothnian Bay, Bothnian Sea, Sounds). The overall spatial distribution remains however stable over the 9-years time series with maximum summer values in the central eastern and southeastern regions, whereas the lowest summer concentrations are observed in the Bothnian Bay and Bothnian Sea, with values equivalent to those recorded in the Skagerrak and Kattegat areas. Mean summer chlorophyll values for the whole basin reach 2.64 mg.m-3 for the SeaWiFS period (1998-2004) and 3.34 mg.m-3 for the MODIS period (2002-2007).
Figure 1. July-August mean chlorophyll maps of the Baltic Sea: data collected from SeaWiFS imagery (1998-2004). Click images to enlarge.

Figure 2. July-August mean chlorophyll maps of the Baltic Sea: data collected from MODIS-Aqua imagery (2002-2007). Click image to enlarge.
Regional differences
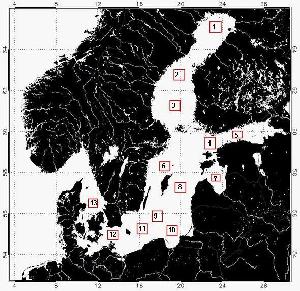
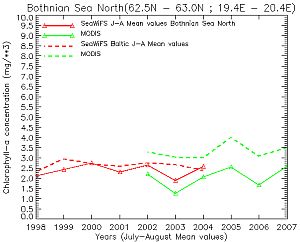
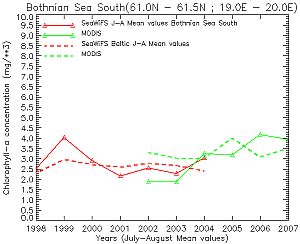
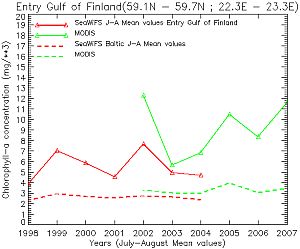
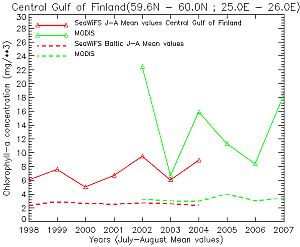
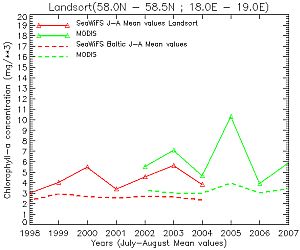
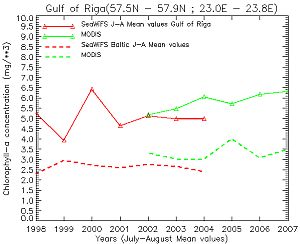
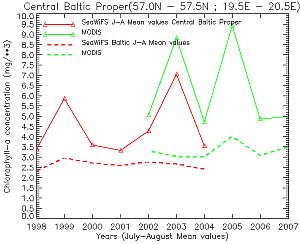
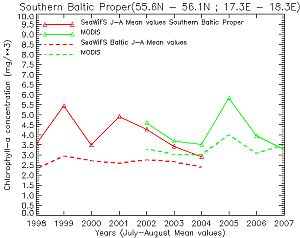
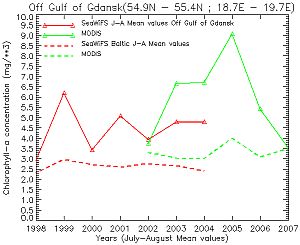
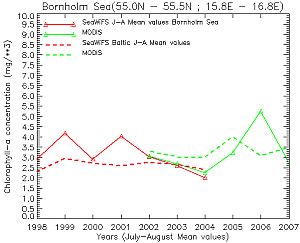
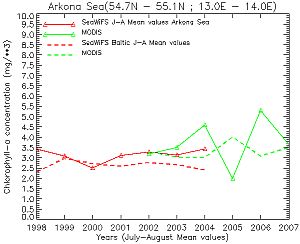
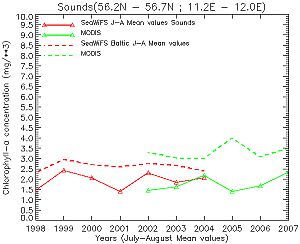
Time series plots are showing the evolution of the summer chlorophyll over 9 years (1998-2007) of satellite data in 13 different provinces of the Baltic Sea. In each of the provinces listed below, a mean chlorophyll concentration is estimated for identified polygons (fig.3) with a mean size of ca. 5900 km2, varying from 3958 km2 in the Gulf of Riga to 7427 km2 in the outer Gulf of Finland.
Starting from North to South:
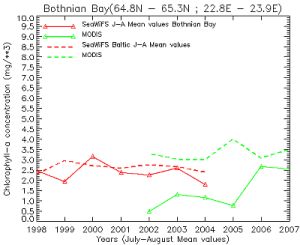
Bothnian Bay: the area is not covered equally by both sensors. MODIS low sampling contributes to a clear difference in chlorophyll values between both sensors and makes the use of these data very difficult. Up to 2004, SeaWiFS data show a rather stable evolution of the chlorophyll around a mean value of 2.5 mg m-3, close to the whole basin average (dashed lines).
Bothnian Sea North: Differences between both sensors are reduced although MODIS tend to give lower values than SeaWiFS in this region. The evolution of summer chlorophyll is stable well within the basin average in the case of SeaWiFS.
Bothnian Sea South: the inter-annual variability is relatively low, with a slight increase in chlorophyll value in 1999. A most striking feature, however, is an increasing trend of chlorophyll in the MODIS period, going from less than 2.0 mg m-3 up to 4.0 mg m-3.
Outer Gulf of Finland: chlorophyll values are well above basin average culminating at ca. 6-7 mg m-3 (around 9mg.m-3 for the MODIS period). The inter-annual variability is high, with maxima in 1999, 2002 and 2005 (possibly in 2007).
Inner Gulf of Finland: mean chlorophyll concentration slightly higher than in the outer Gulf, but the inter-annual variability is slightly reduced during the SeaWiFS period. In contrast, MODIS data vary considerably over time with peaks of summer chlorophyll in 2002 and 2004 (possibly in 2007). As for the outer part of the Gulf, the differences between both sensors are at a maximum, ca. a factor 2 in 2002.
Landsort: mean chlorophyll slightly higher than basin average, ca. 4.5 mg m-3. The inter-annual variability remains detectable with maxima shifted in 2000, 2003, when compared with Gulf of Finland. A large maximum is also observed in 2005 with a chlorophyll concentration almost double relative to mean background values.
Gulf of Riga: Chlorophyll values well above basin average (ca. 5.0 mg m-3 avg.). The inter-annual variability is significant during the first years of SeaWiFS period with maximum summer chlorophyll in 2000. The progression of this variable after 2000 remains rather stable with a tendency to slowly increase during MODIS period. Such positive trend is however not apparent on SeaWiFS overlapping years.
Central Baltic Proper: mean chlorophyll concentrations above basin average. A large inter-annual variability is observed with maxima in 1999, 2003 and 2005. The largest bloom occurred in 2005 with MODIS-derived concentrations up to 8 or 9mg.m-3.
Southern Baltic Proper: Chlorophyll concentrations above basin average. The inter-annual variability is significant, although not as apparent as in the Central Baltic Proper, with maximum summer chlorophyll in 1999, 2001 and 2005.
Outer Gulf of Gdansk: chlorophyll concentrations above basin average. The inert-annual variability is high with maxima in 1999, 2001 and 2005. The differences between SeaWiFS and MODIS are significant in 2003 and 2004, suggesting a possible overestimation of the chlorophyll even during the summer 2005.
´
Bornholm Sea: mean concentration of chlorophyll close to basin average. The inter-annual variability is not so important with a slight increase in 1999 and 2001, as well a maximum in 2006. Both sensors seem to concur over the three overlapping years.
Arkona Sea: mean concentration of chlorophyll equivalent to basin average. The time evolution of summer chlorophyll in this region remains stable, except for MODIS period during which a minimum concentration is observed in 2005, opposite to a situation of maximum usually observed in other regions.
Sounds: mean concentrations of chlorophyll below basin average, oscillating around 2.0 mg.m-3. The inter-annual variability remains low with reasonable agreement between both sensors during the overlapping years.
Trend analysis
To reduce potential bias due to the combination of data sets from multiple instruments, a linear trend was calculated using SeaWiFS time series only (1998-2007). Because of the unavailability of high resolution SeaWiFS data after 2004, this exercise was done using low resolution (9 km) GAC data. Over the 9-years period, no significant trend is observed in summer chlorophyll over the entire basin (slope of the linear fit averaging 0.069 mgchl.m-3 /yr). On the regional basis, the rate of changes span from -0.083 mgchl.m-3 /yr in the Southern Baltic Proper to 0.657 mgchl.m-3 /yr in the Inner Gulf of Finland. These trends remain however not significant (Student’s T-test, p<0.05).
Validity of the chlorophyll product
SeaWiFS and MODIS chlorophyll concentrations are generated with the most recent version of SeaDAS processing software (v. 5.1.5.). The algorithms for both sensors uses a maximum band ratio formulation (O’Reilly et al. 2000) over three bands (443, 490 and 510 nm) for SeaWiFS, and two bands (443, and 488) for MODIS. The capacity for SeaWiFS to use an additional band at 510 nm could explain the differences in chlorophyll values observed between both sensors in regions of high concentrations.
The algorithms are designed for open oceanic waters (so-called case 1 waters). Consequently, it can lead to large uncertainties in the Baltic Sea and in river influenced areas due to the presence of dissolved organic matter and suspended particulate matter other than chlorophyll-containing organisms. Accordingly, the absolute values should be interpreted with caution. The use of ‘standard’ open-ocean algorithms follows the conclusions from a comprehensive evaluation of different formulations (HELCOM, 2004). In this process, it was shown on the basis of a restricted match-up database and uncertainties due to atmospheric correction schemes that none of the tested algorithms (including regional algorithms) could be considered to provide better quality chlorophyll products for the Baltic. The mean relative difference with field measurements ranged from 45% (OC4.v4) to 101% (HELCOM 2004).
Characteristics of the chlorophyll maps:
- Data sets: SeaWiFS (1998-2004) and MODIS (2002-2007) ; http://oceancolour.jrc.ec.europa.eu/
- Projection: cylindrical
- Resolution: 2 km (at the center of the image)
- Algorithm: OC4-v4 (SeaWiFS); OC3M (MODIS)
- July-August mean calculated from daily data
- Log color scale between 0.2 and 10 mg Chl.m-3
Further Readings
- J.E. O’Reilly, et al.: Ocean color chlorophyll a Algorithms for SeaWiFS, OC2 and OC4, version 4. In S.B. Hooker and E.R. Firestone (eds.), NASA Tech. Memo. 2000-206892, vol.11, NASA Goddard Space Flight Centre, Greenbelt, Maryland, pp. 49, 2000.
- HELCOM 2004: validation of algorithms for chlorophyll a retrieval from satellite data in the Baltic Sea area. W. Schrimpf et al., Thematic Report, Baltic Sea Environment Proceedings, no. 94, pp.44, 2004.
- G. Zibordi et al.: Tower-based radiometric observations at a coastal site in the Baltic Proper. Estuarine, Coastal and Shelf Sci., 69: 649-654, 2006.
- M. Darecki et al.: SeaWiFS ocean colour chlorophyll algorithms for the Southern Baltic Sea. Int. J. Rem. Sens., 26, 247-260, 2005.
- F. Mélin and V. Vantrepotte. Multi-year analysis of standard ocean colour products for the European Seas. JRC Scientific and Technical Reports, European Commission, EUR 22916 EN, pp. 123, 2007.
For reference purposes, please cite this indicator fact sheet as follows:
[Author’s name(s)], [Year]. [Indicator Fact Sheet title]. HELCOM Indicator Fact Sheets 2008. Online. [Date Viewed], http://www.helcom.fi/environment2/ifs/en_GB/cover/.
Last updated: 2 December 2008
