|
|
|
 |
This text contains a very brief introduction to the physics of the Black Sea . The circulation of the Black Sea has been studied for over 300 years since the Italian Count Luigi Marsigli described the two layer circulation through the Bosphorus in 1681. By the 1930s, a considerable understanding had been obtained of its overall circulation but important details were missing because of the limitations of the instruments available at the time. It was not until the final two decades of the 20 th Century that more detailed information began to emerge on the variability in the finer scale circulation of the sea and the longer term changes due to ocean/atmosphere coupling. The present text will examine the most significant aspects of our current understanding. |
|
|
| The Black Sea is permanently stratified |
|
Gravity, buoyancy, and wind are the dominant forces acting on the sea and all act together to produce its dynamics of currents, tides and mixing. The gravitational attraction of the moon distorts the ocean surface to produce tides, though in the case of the Black Sea , its surface area is too small for significant surface tides. Buoyancy however, acts to keep less dense layers of water floating on top of denser ones and they remain virtually unmixed unless the buoyancy of either layer changes considerably through warming of the denser layers or cooling of the lighter ones, or if their salt content changes or there is sufficient wind or tidal energy to mix the layers together. Waters of different density can mix together by a process known as molecular diffusion but this is extremely slow and insignificant on the scale of a sea.
The Black Sea has developed two major water layers separated by a strong density gradient, or pycnocline (see Figure 1). The lower layer, below about 70-150 metres (the depth varies from place to place) is saltier and colder than the upper layer. The average surface salinity is 18.2% o , though it can be much lower near river discharges. The lower layer has an average salinity of 21.8% o . This difference is maintained by the 36% o Mediterranean water supplying the lower layer through the Bosphorous and rivers and rain diluting the upper layer. 3.6% o doesn't sound like a huge difference but is sufficient to prevent the bottom, hydrogen sulphide rich water (see Chemistry sheet) from reaching the sea surface and escaping to the atmosphere. For most of the year, this is also helped by the fact that surface waters are usually warmer than deeper ones.
ittle by little, bottom water does mix to form the upper layer and the rate of overall mixing can be judged from the water balance through the Bosphorus because this represents the only entrance of sea water to the Black Sea . In the long term (decades), the salt entering must be the same as that leaving otherwise the sea would soon become saltier or fresher. On average, about 300 cubic kilometres of bottom water mixes into the surface layer each year, equivalent to a layer about 2 mm thick of bottom water per day. This suggests that it would take some 1000 – 2000 years for all of the bottom water to be circulated through the pycnocline. However, this may be a huge oversimplification because mixing does not occur everywhere at the same rate. There is considerable mixing in the Bosphorus for example as the narrow stratified channel brings the Mediterranean and Black Sea surface waters into close proximity. The overall water balance in the Black Sea is illustrated in Table 1.
 |
Figure 1 . Profile of salinity (green line), temperature (red) and density (blue) in the Western basin of the Black Sea in the 2004 BSERP cruise of the RV Akademik. The layer nearest the surface (1) has uniform density because it is mixed by the wind and waves; it is therefore termed the ‘upper mixed layer'. The zone marked ‘2' is the permanent pycnocline. The deep water region (3) has very little variation in density and until recently it has been difficult to study its mixing and circulation. The temperature profile shows how the water is warmed near the surface (this cruise was in late spring) but quickly cools with depth until a Cold Intermediate Layer of about 7?C is reached (4). The deeper sea is warmer, partly reflecting the warmer Mediterranean source water and partly heating from geothermal processes below the sea floor. |
Table 1. Water Balance for the Black Sea (based on the work of Prof. Umit Unluata).
Water Source |
|
km 3 /year |
Rivers |
< |
350 |
Precipitation |
v |
300 |
Lower Bosphorus current |
> |
300 |
Evaporation |
^ |
350 |
Upper Bosphorus current |
< |
600 |
Stratification in the Black Sea is not limited to the separation between the anoxic bottom water and the surface layer however. Another notable feature is the Cold Intermediate Layer (CIL) that can be found in most places just above the permanent pycnocline. It is a layer of colder water than those above or below it and its formation has intrigued oceanographers for many years. It forms in the winter when the sea surface becomes very cold (so cold that ice may form over the sea in the extreme north near Odessa ). The cold water is heavier than that further offshore and sinks below it to settle as a thin layer on the denser pycnocline. It may also form in the centre of the Black Sea in cold and stormy winter conditions. Water from the CIL is very important for the biology of the Black Sea because it is richer in plant nutrients than offshore surface water and probably fertilises the sea when it is mixed back to the surface.
 |
 |
Figure 2. Left hand side: Satellite image of the Bosphorus Strait illustrating its narrow (700 metres at it narrowest) and twisting form. The strait pass through the middle of Istanbul , one of the largest cities in Europe . The Bosphorus has a sill depth of only 35 metres, above which there is a two-layer flow of Mediterranean water flowing to the deep Black Sea (lower layer) and Black Sea surface water flowing towards the Mediterranean (upper layer). Right hand side: Cross section of density along the Bosphorus from the Marmara Sea (left) to the Black Sea (right) showing how the higher density Mediterranean water (red colours) flows over the sill towards the Black Sea . The Black Sea surface water (blue colours) flows towards the Sea of Marmara . As the two streams begin to mix, the Mediterranean water becomes less salty (and less dense) and the Black Sea surface water becomes saltier. The vertical scale is in units of approximately 100m (i.e. 0.4 = 40m). Work conducted in 1994 by Profs. Emin Ozsoy and Michael Gregg. |
|
|
|
Buoyancy: The floatation force of a material of lower density than the liquid it is immersed in.
Salinity: The amount of dissolved solids in seawater, usually expressed in parts per thousand % o. The average salinity in the world ocean is 35% o
Density: The amount of matter per unit volume. In the sea, this is determined by a combination of salinity and temperature.
Stratification: The formation of layers of different density in the sea.
General Circulation is the permanent, time-averaged circulation of the ocean.
Thermohaline Circulation is the circulation, in the meridional (vertical) plane, driven by density differences.
. |
|
|
| Horizontal circulation is characterized by gyres |
| Circulation in the Black Sea is mainly driven by the winds that sweep across it and the buoyancy differences between inflowing freshwater and the saltier Mediterranean inflow. The consequence is a cyclonic circulation throughout the year though not at constant speed. Those that sail in the Black Sea or live by its shores are keenly aware of the intensity of storms that develop in the sea, particularly in winter (see Figure 3). These transfer energy to the circulation causing it to speed up as well as intensifying mixing patterns. |
 |
| |
Figure 3. Winter and summer wind and waves. Figure provided by Prof. G. Korotaev. |
A permanent feature of the upper layer circulation is the Rim Current which encircles the entire Black Sea . In places it is several tens of kilometers wide and can attain a maximum speed of 0.8-1 knot (40-50 cm/sec), increasing sometimes up to 1.6 – 2 knots (80-100 cm/sec). This has been determined by direct observations of the current velocity from surface buoys. Figure 4 shows the average circulation of the Black Sea and Figure 5 illustrates the main features of the circulation in schematic form.
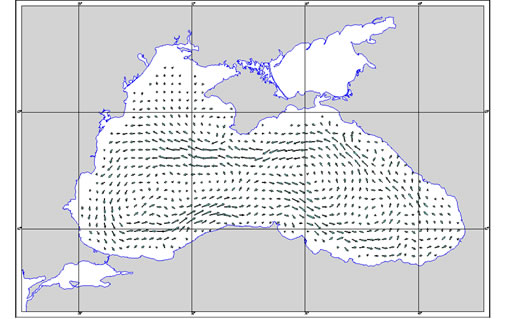 |
Figure 4: Mean annual circulation pattern in the Black Sea ( from Black Sea GIS, BSEP) |
 |
Figure 5 Schematic diagram of the circulation in the Black Sea (Figure provided by Prof. G. Korotaev). |
Figure 5 illustrates the nature of the circulation in gyres; the permanent rim current follows the shelf break most of the time. However, the shape of the coast sends it on seawards short cuts in some place, trapping another small gyre between the rim current and the coast. This is the case for the Batumi Gyre which is a permanent feature. On the inside of the rim current, there are two more-or-less permanent gyres shown as the Eastern and Western Gyres. These have import biological significance as they mark the pathway of planktonic larvae and also keep the inner part of the sea (the pelagic zone) as an area with properties that are distinct from the shelf seas region.
Between the rim current and the coast, there are also a series of non-permanent gyres that are sometime seasonal in nature and are also indicated on Figure 5. These are particularly important on the wide and shallow north western shelf where they help to redistribute Danube and Dnipro water and to mix it with Black Sea surface water. Again, these feature help to explain the distribution of many of the animals and plants in the area as they provide a mechanism for keeping their plankton larvae in the same vicinity as adult populations (see Ecology Fact Sheet for further information).
 |
Figure 6 : Historical distribution of anchovy in the Black Sea . Feeding areas in green, spawning zones in orange and over-wintering areas shaded blue. The entire cycle follows the currents, partly because larval anchovies are planktonic (cannot swim against the current) and their whole lifecycle has adjusted to the circulation. |
|
|
|
Wind-Driven Circulation is the circulation in the upper kilometer of the ocean forced by the wind. The circulation can be caused by local winds or by winds in other regions.
Gyres are wind-driven cyclonic or anticyclonic currents with dimensions nearly that of ocean basins.
Boundary Currents are currents flowing parallel to coasts. The Black Sea Rim current is a particular kind of boundary current
Storm Surges are changes in sea level driven by storms coming ashore on coasts having wide, shallow, continental shelves
Shelf break: The edge of the continental shelf (normally at about 200m depth) where it plunges downward along the continental slope to the abyssal plains (the deep sea floor). In the case of the Black Sea , this is usually a very strong feature, reflecting paleo cliffs in some places. |
| |
Wave-Height : vertical distance between a crest and the preceding trough
Wave-Length : the distance in a periodic wave between two points of corresponding phase in consecutive cycles
Wave Period : the time that elapses between the passage of two successive wave crests past a fixed point
Spectrum: A plot of wavelengths against amplitude (or other measures of energy content). For electromagnetic radiation, the spectrum includes everything from gamma radiation and x-rays to radio waves, with visible light in between. For water waves, the spectrum includes everything between wind ripples to tides. For seismic waves, the spectrum ranges from barely noticeable vibrations to the great long-wave oscillations of earthquakes. For climate fluctuations, the spectrum spans from daily temperature fluctuations to annual seasons to the great ice age cycles. The mathematics of spectral analysis are based on the work of the great French physicist and mathematician J.B. Fourier (1768-1830). |
|
|
| Waves are not only at the surface |
|
Everyone is familiar with waves on the surface of the sea but not all wave patterns are visible to the eye. Underwater waves can also propagate on the pycnocline as ‘internal waves', typically with frequencies of 5-40 cycles/hour and amplitudes as large as 10 metres; these can break when they hit the continent slope in a similar manner to surface waves. There are longer period waves in surface waters however - seiches – with amplitudes of 2-15 cm and periods of 3-10 hours.
Much slower cycling changes are being recognized in the Black Sea associated with planetary scale climatic oscillations that include phenomena such as the ‘North Atlantic Oscillation'. Professor Temel Oguz has devised a series of indexes based on observational data that reveal how periodic climate shifts influence the physics and ecology of the Black Sea (see Figure 7).
 |
Figure 7 . Temporal variations of the atmospheric index (ATI, squares), marine physical climate index (PCI, dots), and ecological index (ECOI, stars) from 1960 to 1999, Note the synchronized oscillations of 10-12 year period. Based on T. Oguz, Oceanography Vol.126 l.18, No.2, June 2005 |
|
|
|
| Advances in measurement are improving our understanding of physical processes |
|
Until the 1970s, our knowledge of physical processes in the sea was largely based upon tedious measurements from ships using an ingenious system of open sampling bottles with lids that could be closed when a weight was dropped down the wire suspending them from a ship. These were fitted with thermometers on a frame that turned upside down when the bottles were triggered and maintained the mercury column within them at the position of the temperature of the sea at the moment of reversal. Samples in the bottles were used to measure salinity and dissolved oxygen or other chemical substances. Surface currents were measured by the drift of the ship when it stopped to lower the bottles.
owadays, these methods have been replaced with electronic sensors that give continuous records of temperature and salinity (as well as other parameters such as oxygen) when they are lowered. These are coupled with bottles that can be closed at any point in the water column. The data in Figure 1 was obtained in this way. Measurements made this way are still rather slow however and do not represent a ‘snapshot' of the conditions in the sea. Advances in space technology have led to arrays of sensors deployed in satellites orbiting the earth and able to measure sea level (and waves) to within a few centimeters resolution, as well as the temperature and colour of the sea (for measuring plant chlorophyll). This is telling us a lot about the sea surface and the small scale fluctuations in its properties (see the image of surface temperature in Figure 8). It is particularly useful for distinguishing features such as mesoscale circulation. However, it does not tell us much about the process below the surface. For this, another kind of technology is required. One technique employed uses drifting buoys that sink gradually through the water column recording temperature and salinity. They are capable of remaining at a great depth, drifting with the current, and can then return to the surface where they transmit their position and data to a satellite before plunging gradually into the depth once again. Several of these ‘Argo' drifters are drifting around the Black Sea and revolutionizing our knowledge of it deep waters, revealing unexpectedly strong currents.
 |
Figure 8. Sea surface temperature measured by AVHRR satellite. The smaller swirls in the image are mesoscale circulation patterns. Photo courtesy of NASA. |
 |
Drifting satellite tracked buoys can also be used to trace individual mesoscale eddies. Results of work conducted in the 2004 BSERP expedition on the Bulgarian vessel Akademik are shown in Figure 9. Six drifters were deployed in a single eddy between Crimea and Cape Kaliakra in Bulgaria . The drifters tracked the eddy as it rotated and followed the rim current. Near Cape Kaliakra , the eddy broke up and two of the buoys moved northwards whereas the others continued to track the rim current. One of the buoys was picked up by a fishing vessel; this explains the strange track (shown in red) near the southern coast.
The value of this data is that is shows us how difficult it is to predict the precise movement of a particle of water in the sea. Imagine if the buoys had been an oil spill!
Physical oceanography is a fascinating study and, as we have demonstrated, the chemistry and biology of the sea depend on the physical processes within it.
|
| Figure 9. Tracks during almost five months drifting of satellite drifter buoys released on the BSERP expedition in April 2004. See text for details. |
|
|
|
Advanced Very-High Resolution Radiometers (AVHRR) are sensors aboard polar orbiting satellites that measure energy at different frequencies in the visible and infra-red bands. These "skin" (upper few mm of the ocean near-surface) measurements are calibrated with in-situ ocean temperature measurements, mostly from the oceanic mixed-layer, to produce estimates of sea surface temperature. There are Local Area Coverage (LAC) and Global Area Coverage (GAC) data with 1 km and 4 km, horizontal resolution, respectively
Mesoscale Eddies are turbulent or wave like flows on scales of a few tens of kilometers.
Squirts or Jets are long narrow currents, with dimensions of a few tens of kilometers, that are nearly perpendicular to west coasts.
|
|
|
|