Cyanobacteria bloom index

|
||||
Key message
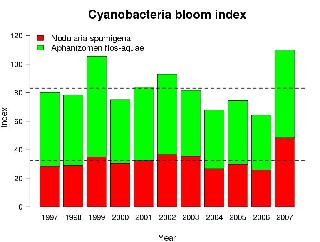
During the assessment period cyanobacteria bloom index showed to be the highest in 2007 and 1999. In the consecutive years the abundance showed large variation. In the year 2006 the index was slightly under the average.
In 2007, the index shows, that the toxic Nodularia spumigena rank based abundance was highest ever recorded and twice as high as in the previous year, while Aphanizomenon flos-aquae showed slightly higher values in the year 1999.
Fig. 1 A. Cyanobacteria bloom index (the total bars consist of the two main nitrogen fixing bloom formers Aphanizomenon flos-aquae indicated with green colour and Nodularia spumigena in red) and the mean (upper black broken line) of overall values, and the toxic Nodularia spumigena index with the mean (lower line) for the years 1997-2007. Click image to enlarge!
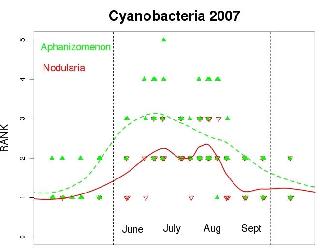
Fig. 1 B. Occurrence of A. flos-aquae (green) and N. spumigena (red) in year 2007, the rank abundance refers to the semiquantitative ranks obtained with the microscopy method of Algaline. The original samples are from automated ship of opportunity sampling between Helsinki and Travemünde (see the section meta data) and the curve was fitted with non-linear smoothing. On the x-axis are the days of the year. The indices were obtained by integrating the area under the fitted curve from the beginning of June to the end of September between the dashed lines. For the cyanobacteria bloom index the area values for the two species were summed up. Click image to enlarge!
Results and assessment
The cyanobacteria bloom index integrates the rank abundance of the two main bloom forming and nitrogen fixing cyanobacteria A. flos-aquae and N. spumigena during the whole growth season in the Baltic Sea. It allows interpretation of cyanobacteria bloom intensity trends over the years. Index for the toxic species N. spumigena shows separately the rank abundance of that species. Blooms of cyanobacteria are associated with high concentrations of phosphate in relation to inorganic nitrogen. In addition, weather conditions, especially intensity of irradiation, water temperature and wind regime have an effect on bloom formation.
Policy relevance and policy references
Initiatives to reduce loads of phosphate and nitrogen to water are a key to reducing cyanobacterial biomass. In addition, initiatives to decelerate global warming ought to be intensified in order to reduce cyanobacteria bloom intensity and duration. There exist no target values for these indices but the long term means function as reference.
Assessment
In period from 1997 to 2007, the cyanobacteria bloom index varied from 70 in 2006 to 115 in 2007 (Fig. 1 A ). The index was above the mean in 1999, 2002 and 2007. Large variability is inherent to cyanobacteria abundances in the Baltic Sea as shown by the differences of the indices of the years 2006 and 2007. The development of the toxic N. spumigena index follows the same patterns as that of cyanobacteria bloom index. In average, one third of the blooms consist of toxic N. spumigena (Fig. 1 A).
References
Laamanen, M. & Kuosa, H. 2005: Annual variability of the biomass and heterocysts of the N2-fixing cyanobacterium Aphanizomenon flos-aquae in the Baltic Sea with reference to Anabaena spp. and Nodularia spumigena – Boreal. Environ. Res. 10: 19-30.
Rantajärvi, E., Olsonen, R., Hällfors, S., Leppänen, J.-M. & Raateoja, M. 1998: Effects of sampling frequency on detection of natural variability in phytoplankton: unattended high frequency measurements on board ferries in the Baltic Sea. – ICES Journal of Marine Science 55(4):697-704.
Ruokanen L., Kaitala S. Fleming V., Maunula P., 2003: Algaline: joint operational unattended phytolankton monitoring system in the Baltic Sea. In: Dahlin, H., Flemming N.C., Nittis K., and Petersson S.E. (eds.); Building the European capacity in Operational Ocenography. Elsevier Ocenography Series 69: 519-522.
Sivonen K., Kononen K., Carmichael W.W., Dahlem A.M., Rinehart K.L., Kiviranta J. & Niemelä S.I. 1989. Occurrence of the hepatotoxic cyanobacterium Nodularia spumigena in the Baltic Sea and structure of the toxin. Appl. Environ. Microbiol. 55:1990-1995.
Meta data
Technical information
1.Source: Finnish Institute of Marine Research, contact person Seppo Kaitala.
2.Description of data: Original unit of measure is obtained by microscopical observation of samples and by ranking them semiquantitatively in ranks from 1 to 5. Original purpose of the data was phytoplankton monitoring of FIMR Alg@line project.
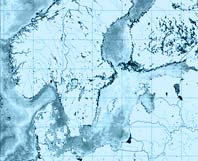
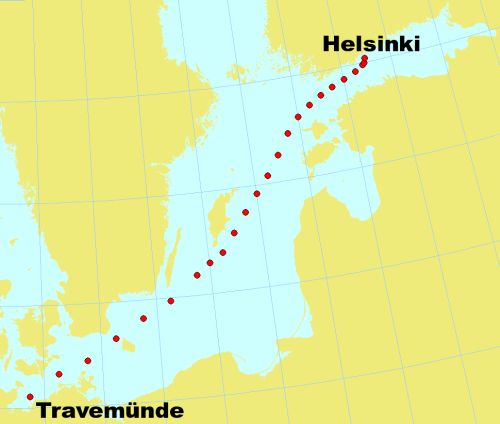
3.Geographical coverage: Gulf of Finland, Archipelago and Åland Seas and the Baltic Sea Proper along the ferry route between Helsinki and Travemünde (Fig. 2). For each crossing, phytoplankton from eight samples are analysed under microscope.
4. Temporal coverage: 1997-2007.
5. Methodology and frequency of data collection: Automated flow-through sampling system on merchant ships, sampling depth ca. 5 m. Samples for microscopical analyses of cyanobacteria are collected at eight of the 24 sampling points (Fig. 3) during the period from February/March to October/November.
6. Methodology of data manipulation: The indices are calculated by integrating the area under the local regression curve representing the occurrence of cyanobacteria (A. flos-aquae and N. spumigena) or toxic N. spumigena alone between the beginning of June to the end of September of the particular year (Fig. 1 B). Over the years the means of the indices are used as a reference point.
Quality information
7. Strength and weakness (at data level): The indices are based on large amount of data, which increase reliability of the indices. The indices can be applied for the whole Baltic Sea as well as for local areas, and for semiquantitative as well as biomass data.
8. Reliability, accuracy, robustness, uncertainty (at data level): Semiquantitative ranking is based on expert judgement, which allows for a certain amount of uncertainty due to possible differences in subjective judgement of individual plankton counters. Nevertheless, the present data have been produced by a single counter.
For reference purposes, please cite this indicator fact sheet as follows:
[Author’s name(s)], [Year]. [Indicator Fact Sheet title]. HELCOM Indicator Fact Sheets 2008. Online. [Date Viewed], http://www.helcom.fi/environment2/ifs/en_GB/cover/.
Last updated: 14 October 2008
