Unusual phytoplankton event during winter-spring 2007-2008
|
||||
Key Message
![]() During winter and spring 2007–2008 an unusual increase in a haptophyte, later identified as Chrysochromulina polylepis, was observed in several parts of the Baltic Sea
During winter and spring 2007–2008 an unusual increase in a haptophyte, later identified as Chrysochromulina polylepis, was observed in several parts of the Baltic Sea
![]() Chrysochromulina polylepis reached up to 4x10⁶ cells L-1 in integrated samples and has been observed in the whole Baltic Sea, except the Bothnian Bay, Gulf of Riga and the Kattegat. No harmful effects have as yet been reported.
Chrysochromulina polylepis reached up to 4x10⁶ cells L-1 in integrated samples and has been observed in the whole Baltic Sea, except the Bothnian Bay, Gulf of Riga and the Kattegat. No harmful effects have as yet been reported.
Relevance of the indicator for describing developments in the environment
As phytoplankton is an important component of the ecosystem, its changes represent changes in the ecosystem. They may be caused by different factors like large inflow of saline or fresh-water, invasion of new species, large import of nutrients or toxic substances (also by accidents), and extreme weather conditions. The reason of unusual phytoplankton events can sometimes not be identified and such sporadic events do hardly allow trend analyses but they communicate, nevertheless, useful information on changes in the environment.
Policy relevance and policy references
Toxic phytoplankton events have high relevance for public health and economy (tourism, fisheries). The Indicator Fact Sheet may not serve for early warning but has importance for long-term documentation of such events. If new species are noticed, this may contribute to the International Convention for the Control and Management of Ships’ Ballast Water and Sediments of the International Maritime Organization (IMO).
Assessment
During winter and spring 2007–2008 unusual increase in a haptophyte belonging to the genus Chrysochromulina was observed in several parts of the Baltic Sea. Samples were collected and analysed by HELCOM partners as a part of the routine national monitoring programmes. Transmission electron microscopical (TEM) analysis, made at the Finnish Institute of Marine Research (FIMR), verified the light microscopical (LM) identification and three different types of scales similar to those of Chrysochromulina polylepis Manton & Parke 1962 were found (Hällfors, S. et al. 2008). The present cells were, however, devoid of the “frog-leg” scales characteristics of C. polylepis and even cell size and shape differed (Fig. 1.) from its authentic stage. DNA analyse was therefore also performed and verified the TEM result.
Fig. 1. LM pictures of Chrysochromulina polylepis cells from different parts of the Baltic Sea. Scale =10 µm (Photo:Susanne Busch, Seija Hällfors and Irina Olenina)
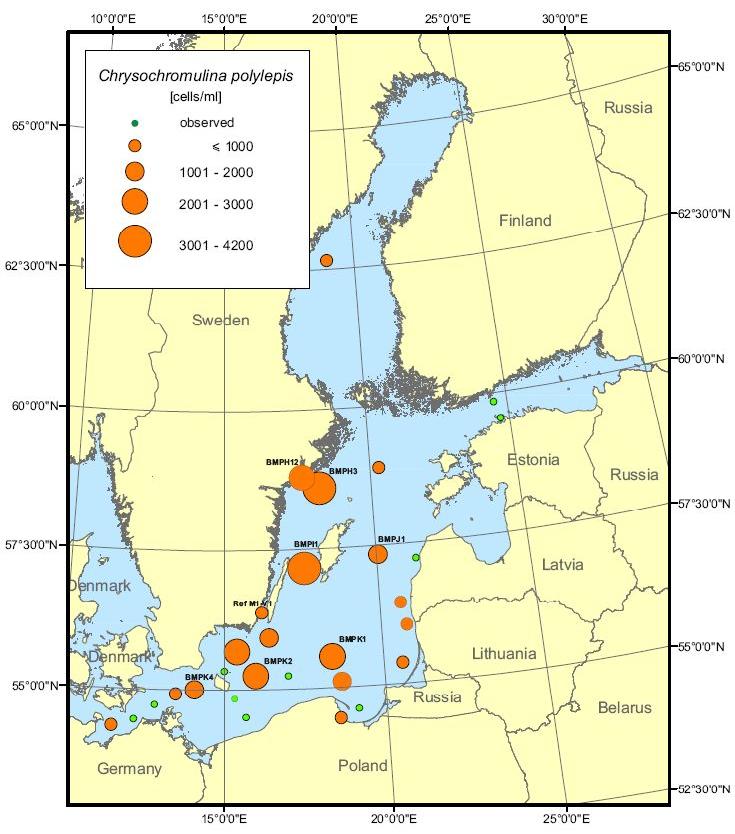
Chrysochromulina polylepis has been observed in the whole Baltic Sea, except the Bothnian Bay and the Gulf of Riga and the Kattegat (Fig. 2.).
Fig. 2. Distribution and maximum abundances of Chrysochromulina polylepis during winter-spring 2007-2008. Stations marked with green represent only occurrence of the species. Click image to enlarge.
Chrysochromulina polylepis started to increase in abundance in late October and during winter (November - February) it reached about 0.4x10⁶ cells L-1 in the central and northern Baltic Sea proper (station BMP K1, BMP I1 and BMP H3, BMP H12, respectively) (Fig. 3.). The species occurred abundantly throughout spring 2008 reaching maximum abundances in April-May about 1-2x10⁶ cells L-1 in the southern and 1-4.2x10⁶ cells L-1 in the central Baltic Sea (Fig. 2 and 3.). In the northern Baltic Sea proper maximum abundance of 3.6x10⁶ cells L-1 was measured in early May.

Fig. 3. Development of Chrysochromulina polylepis abundance during winter-spring 2007-2008 in different parts of the Baltic Sea (a: coastal (BMP H12) and open sea (BMP H3) stations in the western part of the northern Baltic Sea proper, b: coastal (Ref M1V1) and open sea (BMP I1 and BMP J1) stations in the western and eastern Gotland basin, c:open sea stations in the Bornholm basin (BMP K1 and BMP K2), d: open sea station in the Arkona basin (BMP K4).
So long we do not know the reasons of the exceptional and prolonged development of this species. According to the Swedish monitoring data, temperature, salinity and PO4 were higher, DIN lower than the mean value (1995-2004) in the 0-10 m layer at almost all stations (see web sites of SMHI and Stockholm University in references). Higher SiO3 values than usual indicate low amount of diatoms in spring. Available results from a few stations confirm that.
A very similar, not identified, species has been observed since winter 1999 at Swedish stations in the northern Baltic Sea proper. It occurred in high number (up to 1.4x10⁶ cells L-1) during winter 2004/2005 and in smaller amount in winter 2005/2006 (S. Hajdu unpublished data). Salinity and PO4 were higher than the mean value also these winters. If the observed species is also C. polylepis, a more regular occurrence of this potentially toxic species might be expected.
Chrysochromulina polylepis caused extensive fish kills in Scandinavian waters in 1988 (Dahl et al. 1989), but no harmful effects have as yet been reported for the 2007–2008 occurrence. How the mass occurrence of C. polylepis affected the food web remains an open question.
Metadata
Technical information
1. Source: Swedish, German, Lithuanian, Latvian and Polish national monitoring data and Finnish Alg@line data. Sampling locations are presented in Fig. 2.
2. Description of data: Abundance data (cells L-1) in integrated samples (0-10 m, less at some coastal stations) from October 2007 to May/June 2008. Abundance data include only cells >10 µm in length, typical for the observed species. Original purpose of the data: Phytoplankton monitoring programs in the frame of HELCOM.
3. Geographical coverage: Entire Baltic Sea
4. Temporal coverage: Winter-spring 2007-2008 (October-May/June)
5. Methodology and frequency of data collection: Information based on national monitoring samples analyzed and identified by phytoplankton experts, using the mandatory HELCOM methods (http://sea.helcom.fi/Monas/CombineManual2/PartC/CFrame.htm). Species identification by TEM and DNA analyses were performed by specialists at FIMR. Data from nearby stations were pooled. Sampling frequency was monthly or biweekly at stations denominated on Fig. 2. and on Fig. 3. Stations without name, but marked with abundance on Fig. 2.were collected at least 3 times. Maximum abundances on these stations might be underestimated because of sporadic sampling. Stations marked with green point on Fig. 2. were sampled 1-2 times and represent only occurrence of the species.
6. Methodology of data manipulation: Data from nearby stations are pooled (applied especially for station BMP K2 and BMP K1 and some Lithuanian and Latvian coastal stations).
References
Dahl, E., O. Lindahl, E. Paasche, and J. Throndsen. 1989. The Chrysochromulina polylepis bloom in Scandinavian waters during spring 1988. In: (Cosper, E. M. et al., eds.) A novel phytoplankton bloom. Causes and impacts of recurrent brown tides. Springer Lecture Notes on Coastal and Estuarine Studies.
Hällfors, S., G. Hällfors, J-M. Rintala, M. Majaneva, J. Blomster, S. Hajdu, A-T. Skjevik. 2008. A prolonged and exceptional Chrysochromulina cf. polylepis (Prymnesiophyceae) bloom in the Baltic Sea during winter and spring 2007–2008. Accepted Abstract 13th International HAB Conference, Hong-Kong
Web sites:
The Baltic Sea Portal (FIMR, Alg@line): http://www.fimr.fi/en/palvelut/levatiedotus/en_GB/levatiedotus/
SMHI´s AlgAware (Algal reports) and Cruise reports from 2007-2008:
http://www.smhi.se/oceanografi/oce_info_data/reports/cruise/plots_2408.pdf
http://www.smhi.se/oceanografi/oce_info_data/reports/cruise/
Stockholm University, Department of System Ecology, Swedish national monitoring data at station BY31 (BMP H3) and B1 (BMP H12) from 2007-2008: http://www2.ecology.su.se/dbhfj/bystart.htm
FOOTNOTES
1 Department of Systems Ecology, Stockholm University, SE-106 91 Stockholm, Sweden.
hajdus@system.ecology.su.se
2 Finnish Institute of Marine Research, P.O. Box 2, FI–00561 Helsinki, Finland
3 Sea Fisheries Institute ul.Kollataja 1, 81-332 Gdynia, Poland
4Swedish Meteorological and Hydrological Institute, Nya Varvet, SE–42671 Västra Frölunda, Sweden
5 Leibniz Institute for Baltic Sea Research, Seestr. 15, D-18119 Warnemünde, Germany
6 Latvian Institute of Aquatic Ecology, Marine Monitoring Center Dangavgrivas str. 8 LV-1048 Riga, Latvia
7 Centre of Marine Research,Taikos str 26, LT-91149, Klaipeda, Lithuania
8 Umeå Marine Science Center Norrbyn SE-91020 Hörnefors, Sweden
9 Estonian Marine Institute, Tartu University, Mäealuse 10a, 12618 Tallinn, Estonia
10 Tvärminne Zoological Station, University of Helsinki, J.A. Palménin tie 260, FI–10900 Hanko, Finland
11 Department of Biological and Environmental Sciences, University of Helsinki, P.O. Box 65, FI–00014 University of Helsinki, Finland
For reference purposes, please cite this indicator fact sheet as follows:
[Author’s name(s)], [Year]. [Indicator Fact Sheet title]. HELCOM Indicator Fact Sheets 2008. Online. [Date Viewed], http://www.helcom.fi/environment2/ifs/en_GB/cover/.
Last updated: 28 August 2008


