Atmospheric emissions of heavy metals in the Baltic Sea region
|
||||
Key message
![]() Annual emissions of heavy metals from HELCOM countries have decreased during the period from 1990 to 2006 by 47% for cadmium, 45% for mercury, and 86% for lead.
Annual emissions of heavy metals from HELCOM countries have decreased during the period from 1990 to 2006 by 47% for cadmium, 45% for mercury, and 86% for lead.
Results and Assessment
Relevance of the indicator for describing the developments in the environment
This indicator shows the levels and trends in cadmium, mercury, and lead emissions from anthropogenic sources of HELCOM countries to the atmosphere. The emissions of heavy metals represent the pressure of emission sources on the atmosphere of the Baltic Sea region and subsequently on the Baltic Sea aquatic environment.
Policy relevance and policy reference
HELCOM adopted a Recommendation in May 2001 for the cessation of hazardous substance discharges/emissions by 2020, with the ultimate aim of achieving concentrations in the environment near to background values for naturally occurring substances and close to zero for man-made synthetic substances.
On the European level the relevant policy to the control of emissions of heavy metals to the atmosphere is being taken in the framework of UN ECE Convention on Long-Range Transboundary Air Pollution (CLRTAP). The Executive Body of CLRTAP adopted the Protocol on Heavy Metals on 24 June 1998 in Aarhus (Denmark). It targets three particularly harmful metals: cadmium, lead and mercury. According to one of the basic obligations, Parties will have to reduce their emissions for these three metals below their levels in 1990. The Protocols has been signed by 36 and ratified by 22 countries and has been entered into force in 2003.
Assessment
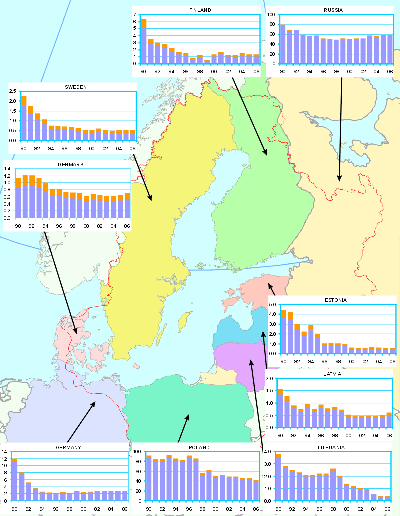
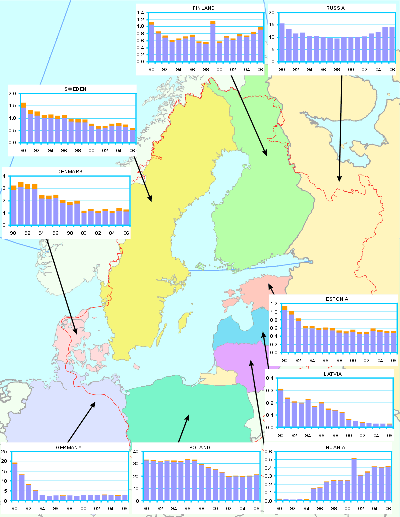
Annual emissions of heavy metals from HELCOM countries have decreased during the period 1990-2006 by 47% for cadmium, 45% for mercury, and 86% for lead (Figure 1). For individual countries, the most significant drop of cadmium emissions can be noted for Lithuania (90%) and Estonia (88%). In case of lead emission, the most significant decrease can be seen for Denmark and Sweden where the emissions in 2006 were more than 20 times lower than in 1990. Mercury emission most significantly decreased in Latvia (92%) and Germany (85%). Essential reduction of annual lead emission of HELCOM countries from 2003 to 2004 is mostly caused by the change of emission in Russia.
The reduction in heavy metal emission to the atmosphere is a consequence of increased use of lead-free fuels, use of cleaner production technologies as well as of economic contraction and industrial restructuring in Poland, Estonia, Latvia, Lithuania, and Russia in early 1990s.
In 2006 total annual emissions of HELCOM countries amounted to 108 tonnes of cadmium, 42 tonnes of mercury, and 1089 tonnes of lead. Among the HELCOM countries the largest contributions to cadmium total emissions of HELCOM countries belong to Russia (55%) and Poland (39%), for lead – to Poland (47%) and Russia (33%), and for mercury – to Poland (52%) and Russia (33%).
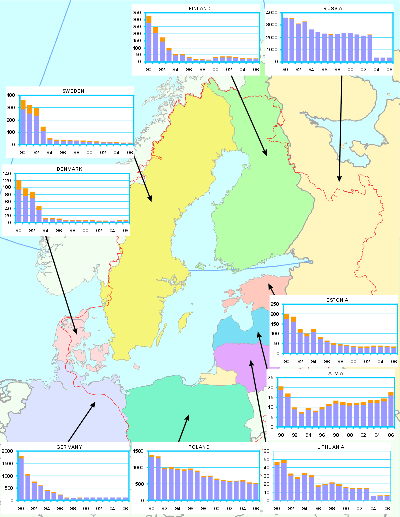
Maps of the Baltic Sea Region and time-series of annual total Cd, Hg, and Pb emissions of HELCOM countries are shown on Figures 2-4. The diagrams on the maps also show the fractions of emissions deposited to the Baltic Sea. The highest fractions belong to Denmark and Sweden (about 20% for lead and cadmium and 10% for mercury), and the lowest one to Russia (about 0.5%).
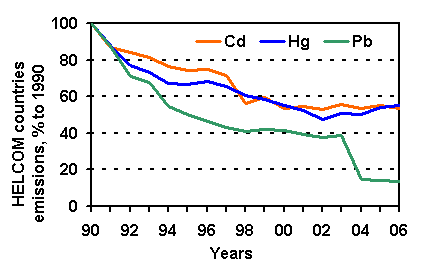
Figure 1. Total annual emissions of cadmium, mercury, and lead to air from HELCOM countries in period 1990-2006 (% of 1990).
Figure 2: Map of cadmium emissions of HELCOM Contracting Parties (CP) to air as totals in tonnes/year for the period 1990-2006. Red sections of the bars identify the fraction of emission deposited to the Baltic Sea. (The emission data of the CP refer to the total area of the CP except for Russian Federation, for which emissions from the territory of Russian Federation within the EMEP domain is used). Click image to enlarge!
Note: different scales have been used for different countries!
Figure 3: Map of mercury emissions of HELCOM Contracting Parties (CP) to air as totals in tonnes/year for the period 1990-2006. Red sections of the bars identify the fraction of emission deposited to the Baltic Sea. (The emission data of the CP refer to the total area of the CP except for Russian Federation, for which emissions from the territory of Russian Federation within the EMEP domain is used). Click image to enlarge!
Note: different scales have been used for different countries!
Figure 4: Map of lead emissions of HELCOM Contracting Parties (CP) to air as totals in tonnes/year for the period 1990-2006. Red sections of the bars identify the fraction of emission deposited to the Baltic Sea. (The emission data of the CP refer to the total area of the CP except for Russian Federation, for which emissions from the territory of Russian Federation within the EMEP domain is used). Click image to enlarge!
Note: different scales have been used for different countries!
Data
Table 1. Cadmium emissions from anthropogenic sources of HELCOM countries from 1990 to 2006. Values of emissions estimated using interpolation are shown in bold. Units: tonnes/year
| 1990 | 1991 | 1992 | 1993 | 1994 | 1995 | 1996 | 1997 | 1998 | 1999 | 2000 | 2001 | 2002 | 2003 | 2004 | 2005 | 2006 | |
| Denmark | 1.1 | 1.2 | 1.2 | 1.1 | 1.0 | 0.8 | 0.8 | 0.7 | 0.7 | 0.7 | 0.6 | 0.7 | 0.6 | 0.6 | 0.6 | 0.7 | 0.7 |
| Estonia | 4.4 | 4.2 | 3.0 | 2.2 | 2.9 | 2.0 | 1.0 | 1.1 | 1.0 | 0.9 | 0.6 | 0.6 | 0.6 | 0.6 | 0.6 | 0.6 | 0.5 |
| Finland | 6.3 | 3.5 | 3.0 | 2.8 | 2.2 | 1.6 | 1.5 | 0.9 | 1.3 | 0.6 | 1.3 | 1.6 | 1.3 | 1.2 | 1.5 | 1.3 | 1.3 |
| Germany | 11.9 | 8.0 | 5.1 | 3.6 | 2.5 | 2.3 | 2.2 | 2.4 | 2.2 | 2.7 | 2.4 | 2.5 | 2.7 | 2.7 | 2.7 | 2.7 | 2.7 |
| Latvia | 1.5 | 1.3 | 0.9 | 0.8 | 1.0 | 0.7 | 0.9 | 0.8 | 0.8 | 0.7 | 0.5 | 0.5 | 0.5 | 0.5 | 0.5 | 0.5 | 0.6 |
| Lithuania | 3.8 | 2.8 | 2.5 | 2.3 | 2.1 | 2.1 | 2.2 | 2.2 | 2.6 | 2.0 | 1.4 | 1.2 | 1.0 | 0.9 | 0.5 | 0.4 | 0.4 |
| Poland | 91.6 | 85.0 | 84.1 | 91.9 | 85.8 | 82.6 | 91.2 | 85.8 | 55.4 | 61.7 | 50.4 | 52.5 | 48.7 | 48.5 | 46.0 | 46.0 | 42.2 |
| Russia | 79.4 | 68.2 | 68.8 | 59.0 | 56.6 | 57.4 | 51.0 | 50.4 | 49.0 | 50.9 | 50.5 | 51.0 | 51.5 | 57.3 | 55.4 | 59.4 | 59.4 |
| Sweden | 2.3 | 1.7 | 1.4 | 1.1 | 0.8 | 0.7 | 0.7 | 0.7 | 0.6 | 0.5 | 0.5 | 0.6 | 0.5 | 0.5 | 0.5 | 0.5 | 0.5 |
| HELCOM | 202 | 176 | 170 | 165 | 155 | 150 | 152 | 145 | 114 | 121 | 108 | 111 | 107 | 113 | 108 | 112 | 108 |
Table 2. Mercury emissions from anthropogenic sources of HELCOM countries from 1990 to 2006. Values of emissions estimated using interpolation are shown in bold. Units: tonnes/year
| 1990 | 1991 | 1992 | 1993 | 1994 | 1995 | 1996 | 1997 | 1998 | 1999 | 2000 | 2001 | 2002 | 2003 | 2004 | 2005 | 2006 | |
| Denmark | 3.2 | 3.5 | 3.3 | 3.3 | 2.4 | 2.4 | 2.5 | 2.0 | 1.9 | 2.0 | 1.2 | 1.3 | 1.2 | 1.3 | 1.1 | 1.4 | 1.3 |
| Estonia | 1.1 | 1.0 | 0.8 | 0.6 | 0.6 | 0.6 | 0.6 | 0.6 | 0.5 | 0.5 | 0.6 | 0.5 | 0.5 | 0.6 | 0.5 | 0.5 | 0.5 |
| Finland | 1.1 | 0.9 | 0.7 | 0.6 | 0.7 | 0.7 | 0.8 | 0.6 | 0.5 | 1.1 | 0.6 | 0.7 | 0.7 | 0.8 | 0.7 | 0.9 | 1.0 |
| Germany | 19.2 | 13.3 | 8.4 | 5.3 | 2.8 | 2.4 | 2.5 | 2.5 | 2.6 | 2.4 | 2.7 | 2.7 | 2.8 | 2.9 | 2.8 | 2.7 | 2.8 |
| Latvia | 0.3 | 0.2 | 0.2 | 0.2 | 0.2 | 0.2 | 0.2 | 0.1 | 0.1 | 0.1 | 0.1 | 0.0 | 0.0 | 0.0 | 0.0 | 0.0 | 0.0 |
| Lithuania | 0.0 | 0.0 | 0.0 | 0.0 | 0.0 | 0.2 | 0.2 | 0.2 | 0.2 | 0.3 | 0.3 | 0.5 | 0.3 | 0.4 | 0.4 | 0.4 | 0.4 |
| Poland | 33.3 | 32.7 | 31.9 | 32.5 | 32.4 | 32.3 | 33.6 | 33.0 | 29.5 | 27.1 | 25.6 | 23.2 | 19.8 | 20.2 | 19.8 | 20.1 | 21.3 |
| Russia | 15.6 | 13.4 | 11.4 | 11.8 | 10.4 | 10.4 | 10.1 | 9.6 | 9.4 | 9.9 | 10.0 | 10.1 | 10.2 | 11.4 | 11.9 | 14.0 | 14.0 |
| Sweden | 1.6 | 1.3 | 1.3 | 1.1 | 1.2 | 1.1 | 1.1 | 1.0 | 0.9 | 0.9 | 0.8 | 0.7 | 0.7 | 0.8 | 0.8 | 0.7 | 0.6 |
| HELCOM | 76 | 66 | 58 | 56 | 51 | 50 | 52 | 50 | 46 | 44 | 42 | 40 | 36 | 38 | 38 | 41 | 42 |
Table 3. Lead emissions from anthropogenic sources of HELCOM countries from 1990 to 2006. Values of emissions estimated using interpolation are shown in bold. Units: tonnes/year
| 1990 | 1991 | 1992 | 1993 | 1994 | 1995 | 1996 | 1997 | 1998 | 1999 | 2000 | 2001 | 2002 | 2003 | 2004 | 2005 | 2006 | |
| Denmark | 120 | 97 | 88 | 47 | 12 | 12 | 10 | 8 | 7 | 7 | 7 | 6 | 5 | 5 | 5 | 6 | 6 |
| Estonia | 201 | 185 | 121 | 101 | 124 | 84 | 65 | 52 | 46 | 44 | 37 | 34 | 34 | 39 | 38 | 37 | 34 |
| Finland | 327 | 248 | 174 | 99 | 58 | 56 | 35 | 18 | 21 | 15 | 36 | 38 | 40 | 34 | 28 | 24 | 25 |
| Germany | 1801 | 1055 | 761 | 606 | 405 | 331 | 222 | 95 | 94 | 95 | 102 | 105 | 106 | 105 | 106 | 107 | 108 |
| Latvia | 21 | 17 | 10 | 8 | 10 | 8 | 10 | 12 | 13 | 12 | 12 | 12 | 12 | 13 | 13 | 14 | 18 |
| Lithuania | 47 | 49 | 32 | 28 | 33 | 30 | 18 | 20 | 22 | 19 | 16 | 15 | 15 | 15 | 5 | 6 | 6 |
| Poland | 1372 | 1336 | 986 | 997 | 966 | 937 | 960 | 896 | 736 | 745 | 647 | 610 | 588 | 596 | 600 | 536 | 524 |
| Russia | 3591 | 3553 | 3095 | 3276 | 2643 | 2426 | 2304 | 2247 | 2262 | 2339 | 2352 | 2235 | 2118 | 2207 | 330 | 355 | 355 |
| Sweden | 361 | 317 | 296 | 144 | 51 | 37 | 33 | 33 | 32 | 29 | 26 | 23 | 20 | 19 | 18 | 15 | 14 |
| HELCOM | 7840 | 6856 | 5563 | 5304 | 4301 | 3920 | 3656 | 3380 | 3233 | 3306 | 3235 | 3079 | 2939 | 3034 | 1143 | 1099 | 1089 |
Meta data
Technical information:
1. Source: EMEP/MSC-E, UN ECE Secretariat
2. Description of data: Annual total emissions of all three metals were officially reported to the UN ECE Secretariat by HELCOM countries. These data are available from the EMEP Centre on Emission Inventories and Projections (CEIP) (http://www.emep-emissions.at/ceip/).
3. Geographical coverage: European region
4. Temporal coverage: Data on lead, cadmium, and mercury annual emission totals are available for the period 1990 – 2006 for all HELCOM countries but Russia. The Russian Federation did not submitted information for 2001 and 2006. Values of emissions from Russia for 2001 were obtained using interpolation between emissions for 2000 and 2002. For the 2006 the same level of emissions as for 2005 was assumed in model simulations.
5. Methodology and frequency of data collection: National data on HM emissions are annually submitted by countries Parties to CLRTAP Convention to the UN ECE Secretariat. The methodology is based on combination of emission measurements and emission estimates based on activity data and emission factors. Submitted emission data are processed using quality assurance and quality control procedure and stored in the UN ECE/EMEP emission database at EMEP/CEIP Centre.
Quality information:
6. Strength and weakness: Strength: data on emissions are annually submitted, checked and stored in the database
Weakness: gaps in time series of national emissions, uncertainties in national emissions, lack of gridded emissions, and incompleteness
7. Uncertainty: Among the HELCOM countries the level of uncertainty of official data on HM emission was reported by Denmark and Finland. From the EMEP countries the information on uncertainties of HM official emissions is available for Austria, France, and the United Kingdom. The uncertainty of reported data on HM emissions expressed as percentage relative to mean value of emission is as follows:
Finland: Hg -37% - +37%
Pb -33% - +33%
Cd -37% - +37%
Denmark: Hg -63% - +63%
Pb -42% - +42%
Cd -128% - +128%
Austria: Hg -43% - +93%
Pb -52% - +110%
Cd -48% - +116%
France: Hg -63% - +63%
Pb -53% - +53%
Cd -52% - +52%
UK: Hg -30% - +40%.
Pb -30% - +40%.
Cd -20% - +40%.
8. Further work required: Further work of national experts on emissions of dioxins and furans is required to fill the gaps in the emission time-series and to reduce their uncertainties.
For reference purposes, please cite this indicator fact sheet as follows:
[Author’s name(s)], [Year]. [Indicator Fact Sheet title]. HELCOM Indicator Fact Sheets 2008. Online. [Date Viewed],
http://www.helcom.fi/environment2/ifs/en_GB/cover/.
Last updated: 28.8.2008
