Phytoplankton spring bloom biomass in the Gulf of Finland, Northern Baltic Proper and Arkona Basin in 2008

|
||||
Key message
![]() The spring bloom intensity was close to the previous year in the Gulf of Finland, the Northern Baltic Proper and Arkona Basin.
The spring bloom intensity was close to the previous year in the Gulf of Finland, the Northern Baltic Proper and Arkona Basin.
![]() No rising trend can be detected from 1992 to 2008 in the Gulf of Finland, the Northern Baltic Proper or the Arkona Basin.
No rising trend can be detected from 1992 to 2008 in the Gulf of Finland, the Northern Baltic Proper or the Arkona Basin.
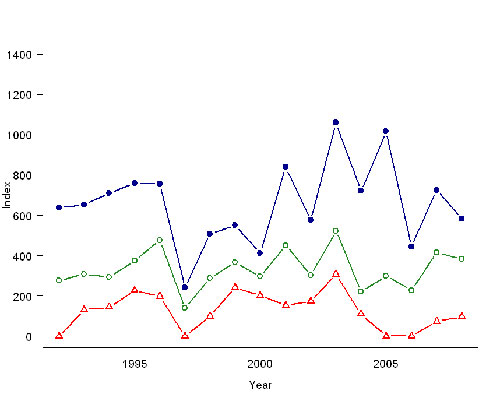
Fig. 1: Development of the spring bloom intensity from 1992 to 2008 in Arkona Basin (AB), the northern Baltic Proper (NB) and the western Gulf of Finland (GOF).
Results and assessment
Environmental context
Chlorophyll a concentration is a relative measure of phytoplankton biomass in the water. Since high nutrient concentrations increase phytoplankton growth and subsequently the intensity and frequency of blooms, chlorophyll a can be used as an indicator of the eutrophication in a sea basin.
The intensity of the spring bloom reflects the scale of the nutrient reserves. The spring bloom species of diatoms and dinoflagellates consume most of the phosphorus and nitrogen nutrients that were built up in the water mass during the previous winter.
Policy relevance
The availability of nutrients regulates the primary production and biomass of planktonic algae and the nutrient ratio of the main nutrients nitrogen and phosphorus largely determines which species can proliferate. The eutrophication of the Baltic Sea is still accelerated by the diffuse loading of nutrients from the whole drainage area and air as well as from activities at sea.
The spring bloom estimate for the Western Gulf of Finland
The spring bloom intensity index in 2008 was below the previous year and the ten-year average (1998-2007) (Fig. 1). The bloom period was shorter than the previous year, and the peak was lower (Fig. 2, Appendix 1). The bloom started a week later than average.
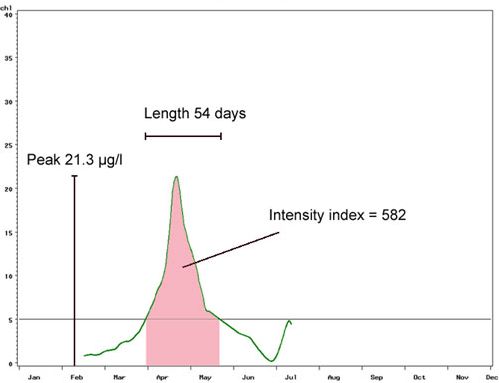
Fig. 2: The seven-day running average chlorophyll a curve in 2008 in the western Gulf of Finland (green). Pink ‘area’ illustrates the intensity index of the spring bloom, the spring bloom threshold is shown with a solid black line. Also the peak and length of bloom are presented.
The spring bloom estimate for the Northern Baltic Proper
The 2008 spring bloom intensity index was at the same level as the previous year and above the long time average (Fig. 1, Fig. 3). The spring bloom starting date was close to average, and a day later than in the Gulf of Finland (Appendix 1).
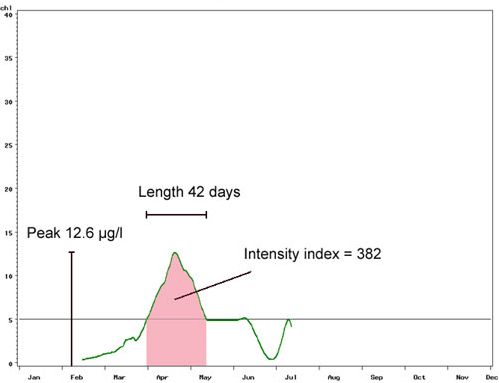
Fig. 3: The seven-day running average chlorophyll a curve in 2008 in the northern Baltic Proper (green). Pink ‘area’ illustrates the intensity of the spring bloom, which is calculated as the intensity index; the spring bloom threshold is shown with a solid black line. Also the peak and length of bloom are presented.
The spring bloom estimate for the Arkona Sea
In the Arkona Sea the spring bloom often is negligible. In 2008 the spring bloom seven day running average rose above the threshold of 5 µg/l both in April and in May, resulting in a two-peaked spring bloom estimate slightly more intense than the previous year (Fig. 4). The bloom was however less intense than average (Fig. 1).
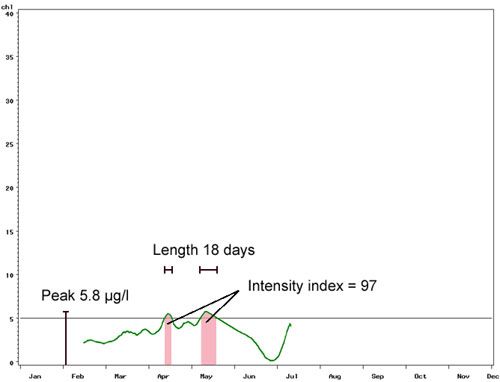
Fig. 4: The seven-day running average chlorophyll a curve in 2008 in the Arkona Basin (green). The intensity index is presented, and the spring bloom threshold is shown with a solid black line.
References
Fleming, V. & Kaitala, S. 2007. Phytoplankton spring bloom intensity index for the Baltic Sea estimated for the years 1992 to 2004. Hydrobiologia 554, 57-65.
Metadata
Technical information
2. Description of data:
Original unit of measure: mg chl a m-3
Original purpose of the data: Phytoplankton monitoring of FIMR, Alg@line project
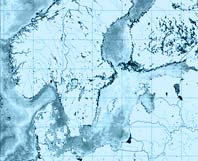
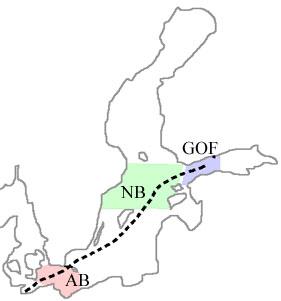
3. Geographical coverage: Gulf of Finland, Archipelago and Åland Sea, the Baltic Proper (Fig. 5).
4. Temporal coverage: 1992-2008.
5. Methodology and frequency of data collection: Automated flow-through sampling system on merchant ships, sampling depth ca. 5 m, fluorescence measurements every 100 to 300 meters during the period February to November. The fluorescence is calibrated to chlorophyll a using the weekly chlorophyll a samples. Interpolation of calibration constant is used in order to calibrate measurements also for the transects not taking water samples.
6. Methodology of data manipulation: The spring bloom is estimated setting a chlorophyll a threshold level of 5 µg/l for the beginning and end of the bloom. The intensity index is calculated by integrating the ‘area’ under the chlorophyll seven-day average curve (pink area in figures 2 to 4). Also the length, peak and mean chlorophyll a level during the bloom are calculated.
Special cases:
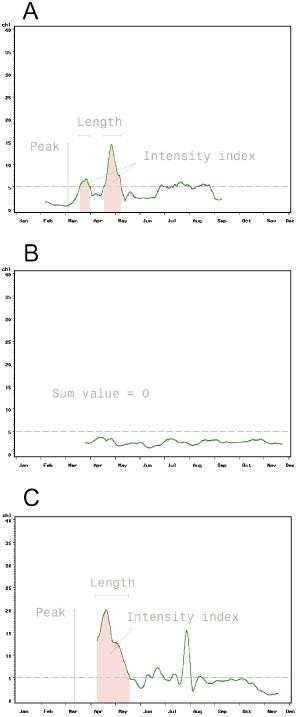
If the chlorophyll a value decreases below the threshold in the middle of the bloom, the bloom is regarded to consist of two separate periods. Thus the intensity index and the length of the bloom is calculated using only the periods exceeding the threshold (Fig. 6a).
If the spring bloom does not exceed the threshold, the intensity index is zero, as well as the length, peak and mean values (Fig 6b).
If the data does not cover the beginning of the bloom (data collection has started too late), the calculated intensity index as well as length and mean values are smaller than in reality (Fig 6c). In appendix 1 these years are marked with an asterisk.
Fig. 6: The seven-day running average chlorophyll a curve (green), with spring bloom intensity index highlighted (pink area). a) A case where the spring bloom consists of two periods b) a case where spring bloom chlorophyll a level does not exceed the threshold c) a case where the data does not cover the beginning of the bloom.
Quality information
7. Strength and weakness (at data level):
Strength: Very high both temporal and spatial sampling frequency. Weaknesses: 1. The flow through chlorophyll a is not as accurate as measured directly from water samples, due to the fluorescence calibration method. 2. During some years data collection starts too late to cover the beginning of the spring bloom in the Southern Baltic; this is inevitable since sometimes the Gulf of Finland is still covered with ice at the start of the Southern Baltic spring bloom.
8. Reliability, accuracy, precision, robustness (at data level):
Measurement uncertainty: Chl a: 1 µg/l l if the concentration < 5.0 µg/l, 2.0 µg/l if the concentration > 10.0 µg/l.
9. Further work required (for data level and indicator level):
During some years the data collection started too late to cover the beginning of the spring bloom, due to ice in the Northern Baltic. In further development of the method one could take into account the missing data, possibly by approximating a starting date using information of the progress and beginning of bloom during previous years.
Appendix
Table 1: The spring bloom estimates for Arkona Basin (AB), the northern Baltic Proper (NB) and the western Gulf of Finland (GOF) from 1992 to 2008. Estimates: spring bloom intensity index, mean chl a during bloom, length of bloom, highest peak of the bloom and the starting day of the bloom. Years in which data have not covered the beginning of the bloom are marked with an asterisk.
| Sea-area | Year | Index | Mean (ug/l) | Length (days) | Peak (ug/l) | Start day |
| Arkona Basin | 2008 | 97 | 5.4 | 18 | 5.8 | 15-April |
| 2007 | 73 | 6.7 | 11 | 8.1 | 9-May | |
| 2006 | 0 | 0 | ||||
| 2005 | 0 | 0 | ||||
| 2004 | 108 | 6.0 | 18 | 6.8 | 25-March | |
| 2003* | 307 | 8.3 | 37 | 13.4 | 11-March | |
| 2002 | 173 | 7.9 | 22 | 10.9 | 22-March | |
| 2001* | 152 | 7.2 | 21 | 8.6 | 19-March | |
| 2000* | 202 | 6.7 | 30 | 9.7 | 27-March | |
| 1999* | 241 | 7.8 | 31 | 14.8 | 10-April | |
| 1998 | 99 | 6.6 | 15 | 7.6 | 21-March | |
| 1997 | 0 | 0 | ||||
| 1996 | 197 | 6.0 | 33 | 8.9 | 10-April | |
| 1995 | 228 | 7.1 | 32 | 10.4 | 26-March | |
| 1994 | 143 | 7.2 | 20 | 8.9 | 29-March | |
| 1993 | 131 | 7.7 | 17 | 9.7 | 23-March | |
| 1992 | 0 | 0 | ||||
| Northern Baltic Propoer | 2008 | 382 | 9.1 | 42 | 12.6 | 3-April |
| 2007 | 415 | 8.7 | 48 | 12.5 | 6-April | |
| 2006 | 228 | 9.1 | 25 | 12.0 | 6-April | |
| 2005 | 300 | 7.5 | 40 | 12.9 | 30-March | |
| 2004 | 220 | 8.1 | 27 | 11.2 | 2-April | |
| 2003 | 522 | 9.3 | 56 | 14.5 | 3-March | |
| 2002 | 303 | 9.5 | 32 | 13.2 | 4-April | |
| 2001 | 451 | 11.3 | 40 | 17.3 | 27-March | |
| 2000 | 296 | 9.9 | 30 | 13.6 | 9-April | |
| 1999* | 367 | 11.8 | 31 | 15.1 | 11-April | |
| 1998 | 287 | 8.2 | 35 | 14.4 | 22-March | |
| 1997 | 140 | 6.1 | 23 | 7.5 | 25-April | |
| 1996 | 477 | 9.0 | 53 | 17.1 | 5-April | |
| 1995 | 375 | 8.7 | 43 | 12.6 | 15-April | |
| 1994 | 294 | 8.2 | 36 | 12.7 | 13-April | |
| 1993 | 307 | 10.2 | 30 | 15.0 | 14-April | |
| 1992 | 277 | 6.9 | 40 | 9.2 | 10-April | |
| Western Gulf of Finland | 2008 | 582 | 10.8 | 54 | 21.3 | 2-April |
| 2007 | 726 | 12.7 | 57 | 26.0 | 28-March | |
| 2006 | 443 | 12.7 | 35 | 19.4 | 8-april | |
| 2005 | 1016 | 16.9 | 60 | 32.8 | 26-April | |
| 2004 | 722 | 9.3 | 78 | 16.2 | 27-Feb | |
| 2003* | 1060 | 14.5 | 73 | 28.8 | 12-March | |
| 2002 | 576 | 12.8 | 45 | 21.8 | 3-April | |
| 2001 | 839 | 16.1 | 52 | 33.9 | 19-March | |
| 2000 | 413 | 10.9 | 38 | 15.4 | 6-April | |
| 1999* | 551 | 13.1 | 42 | 20.0 | 12-April | |
| 1998 | 508 | 9.1 | 56 | 18.4 | 21-March | |
| 1997 | 241 | 8.3 | 29 | 12.8 | 20-April | |
| 1996 | 755 | 12.2 | 62 | 24.8 | 8-April | |
| 1995 | 759 | 13.5 | 56 | 25.4 | 8-April | |
| 1994 | 710 | 11.4 | 62 | 19.0 | 31-March | |
| 1993 | 652 | 12.8 | 51 | 25.4 | 11-April | |
| 1992 | 638 | 13.3 | 48 | 24.5 | 1-April |
For reference purposes, please cite this indicator fact sheet as follows:
[Author’s name(s)], [Year]. [Indicator Fact Sheet title]. HELCOM Indicator Fact Sheets 2008. Online. [Date Viewed], http://www.helcom.fi/environment2/ifs/en_GB/cover/.
Last updated: 1 October 2008
