Temporal and spatial variation of dissolved surface nutrients in the Gulf of Finland, The Northern Baltic Proper and the Bornholm Sea from 1951 to 2008
|
||||
Key messages
![]() The HELCOM target level for phosphate-phosphorus (PO4-P) and for the sum of nitrate- and nitrite-nitrogen ((NO3+NO2)-N) has not been met in the Gulf of Finland, the Northern Baltic Proper and the Bornholm Sea.
The HELCOM target level for phosphate-phosphorus (PO4-P) and for the sum of nitrate- and nitrite-nitrogen ((NO3+NO2)-N) has not been met in the Gulf of Finland, the Northern Baltic Proper and the Bornholm Sea.
![]() In 2008, the winter maximum levels of PO4-P and (NO3+NO2)-N were reached later than usual (February-March) in the Gulf of Finland and the Northern Baltic Proper.
In 2008, the winter maximum levels of PO4-P and (NO3+NO2)-N were reached later than usual (February-March) in the Gulf of Finland and the Northern Baltic Proper.
![]() In the Bornholm Sea, the winter surface NO3-N concentrations were higher than during the previous years.
In the Bornholm Sea, the winter surface NO3-N concentrations were higher than during the previous years.
Results and assessment
Relevance of the indicator for describing developments in the environment
The Baltic Sea is strongly affected by seasonality: during winter the water is rich in nutrients, but as long as the surface water stratification remains weak and the availability of light is limited, the phytoplankton biomass remains low. As the surface water stratifies and the amount of light increases during the short spring period, the biomass of phytoplankton increases massively. After the dissolved nitrogen is depleted from the surface water during the phytoplankton spring bloom the phytoplankton biomass decreases. The amount of phosphate left over varies between the years. When the sea water warms up during the summer, the blue-green algae become more common utilizing the surplus phosphate. The occasional upwelling of deeper, nutrient-rich water can stimulate the phytoplankton growth.
The amount of nutrients together with temperature and stratification variation and the amount of light form the basis for phytoplankton succession. Nutrients as such indicate the anthropogenic pressures of eutrophication.
Policy relevance and policy references
Nutrients and their ratios form the preconditions for the overall eutrophication as well as harmful algal blooms. The traditional HELCOM COMBINE program based on sampling with research vessels has limited spatial and temporal coverage. The high-frequency Alg@line ship-ofopportunity monitoring reveals the short-term fluctuations and patchiness in the Baltic environment.
Assessment
Annual and seasonal variation
The inorganic nutrient level typically increases during late fall to reach its annual peak during winter and decreases during spring. At summer, the nutrients in the euphotic layer are mostly bound to living matter. During 2008, the concentrations of both (NO3+NO2)-N and PO4-P near the surface increased until March-April in the Gulf of Finland and until February in the Northern Baltic Proper and the Bornholm Sea (Fig. 1). This is considerably later than during the previous two years.

Spatial distribution of surface nutrients during winter
During January 2008, the NO3-N concentration at the surface remained below 5 μmol l-1 in most 3-N concentration at the surface remained below 5 μmol l-1 in most of the Baltic Proper and the Bothnian Sea. In the Gulf of Finland, the concentration increased eastward, from below 7 μmol l-1 in the west to over 14 μmol l-1 in the easternmost parts of the Gulf. Elevated levels were also observed in the Archipelago Sea, the Quark and in parts of the Bothnian Bay (Fig. 2). The (NO3+NO2)-N concentration (figs. 1 and 3) is described very well by the NO3-N concentration, as almost all of it is in NO3 –form (Fig. 5).
The surface concentration of PO4-P was lowest in the Bothnian Bay and the Bothnian Sea, where the levels did not rise above 0.4 μM. The highest concentrations were observed in the eastern Gulf of Finland, reaching levels over 1.0 μM.
It must be born in mind, that according to the Alg@line observations taken near the surface (Fig. 1), the annual peaks for both PO4-P and (NO3+NO2)-N were not reached in by January. Thus the spatial distribution collected during the HELCOM Combine 1 cruise does not present the winter maximum level, in other words the amount of nutrients available for the phytoplankton springbloom.

Long term development and state
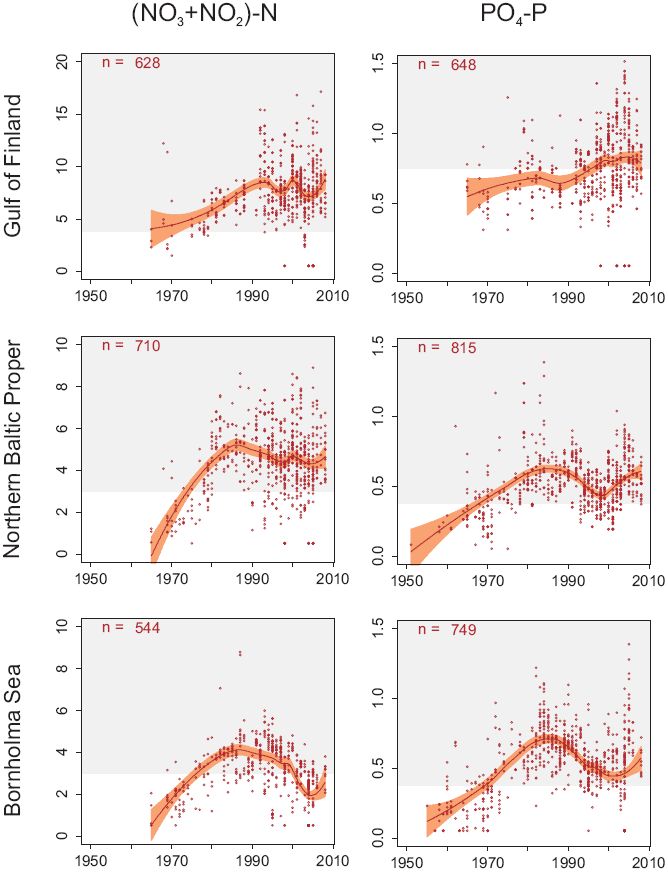
The winter (from December to February) concentrations of surface (NO3+NO2)-N increased steadily from the time of the first observations in the 1960s, and reached its peak in the 1980s or 1990s. After that, the concentrations leveled out in the Gulf of Finland and decreased in the Northern Baltic Proper and Bornholm Sea.
In the Northern Baltic Proper and the Bornholm Sea the winter surface concentration of PO4-P nearly tripled from the 1960s to the 1980s, after which it decreased and more or less leveled out in the late 1990s. In the Gulf of Finland the concentration at the time of the first observations was higher already in the late1960s than it was during the peak years of the late 1970s in the Northern Baltic Proper and the Bornholm Sea. The concentration in the Gulf of Finland increased until 1980, when it leveled out for a few years, only to increase again from 1990 to the end of the 20th century. During the last couple of years the winter concentration has been slightly lower than in the early 2000s.
The HELCOM target levels for winter nutrients have not been met at any of the three sub-areas. In all areas, a considerable number of observations from the last few winters were above the target concentration for both nitrogen and phosphorus.

References
Fleming-Lehtinen, V., Laamanen, M., Kuosa, H., Haahti, H. and Olsonen, R. 2008. Long-term development of inorganic nutrients and chlorophyll a in the open northern Baltic Sea. Ambio 37:86-92.
HELCOM 2007. HELCOM Baltic Sea Action Plan. http://ww.helcom.fi/BSAP/en_GB/intro/.
Metadata
Technical information
1. Data source: The FIMR, Alg@line and ICES databases.
2. Description of data: The water samples used in the analysis on seasonal variation have been collected on the Finnmaid ferry by the Alg@line project. The data used in the analysis on spatial distribution has been collected onboard the research vessel Aranda by FIMR. The long term data includes both of the above, added with data collected by several institutes and received from the ICES database.

3. Geographical coverage: The winter-time COMBINE1 data presented in Fig. 1 and the longterm dataset presented in Fig. 3 cover the entire Baltic Sea. The Algaline-data covers the western Gulf of Finland, the Baltic Proper and the Arkona Sea along a transect from Helsinki to Travemünde (Fig. 4).
4. Temporal coverage: Alg@line-reference: 1992-2008 throughout the year. Long-term dataset: 1951-2008, from December to February.
5. Methodology and frequency of data collection: Algaline dataset: samples once a week to once every two weeks. Long-term dataset: several samples per year.6. Methodology of data manipulation: In the analysis on spatial distribution data has been manipulated by response surface fitting. The long-term data has been analysed by fitting a Loess curve (span 0.6) with 95% confidence intervals.
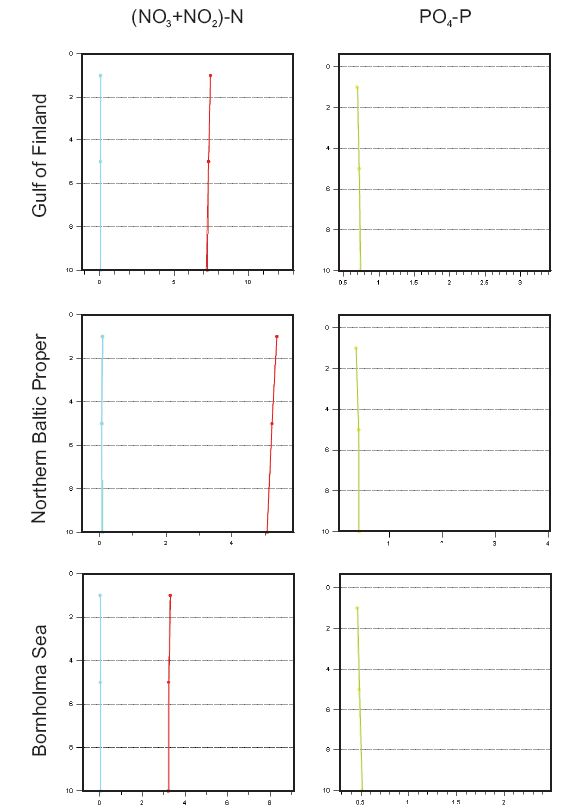
7. Strength and weaknesses of data: Strength: Medium temporal and spatial sampling frequency. Weakness: storage time of samples from hours to a couple of days depending on the sampling site. The Alg@line sampling depth is 5m and presents 0-5m watermass, where the nutrient concentration during wintertime is fairly homogenous (Fig. 5).

8. Reliability, accuracy, robustness, uncertainty (at data level): The FIMR data is collected according to the FINAS accredited auditing system.
9. Further work required (for data level and indicator level): The indicator will be updated annually.
For reference purposes, please cite this indicator fact sheet as follows:
[Author’s name(s)], [Year]. [Indicator Fact Sheet title]. HELCOM Indicator Fact Sheets 2008. Online. [Date Viewed], http://www.helcom.fi/environment2/ifs/en_GB/cover/.
Last updated: 27 January 2009

