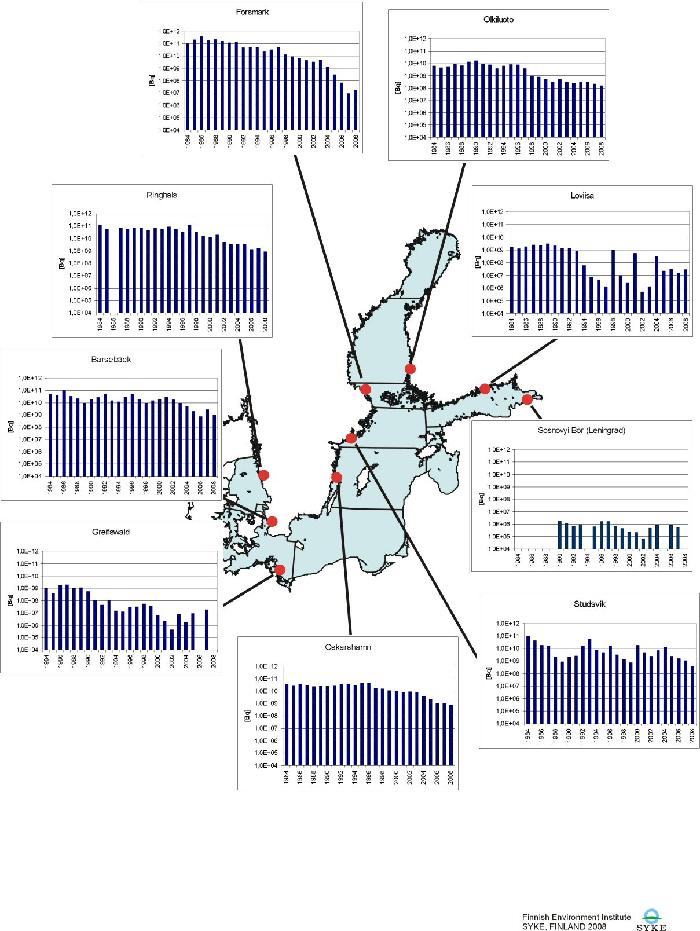
Liquid discharges of Cs-137, Sr-90 and Co-60 into the Baltic Sea from local nuclear installations
|
||||
Key message
In general, there has been a decreasing trend in the discharges of caesium-137, strontium-90 and cobalt-60 from the local nuclear power plants into the Baltic Sea during the last decade. In 2008, the total discharges of caesium-137, strontium-90 and cobalt-60 into the Baltic Sea were 1.7, 27 and 3.2 GBq (gigabequerells), respectively.
Relevance of the indicator for describing the discharges of radioactive substances into the Baltic Sea
The predominant radionuclide in the liquid discharges from the nuclear power plants and research reactors in the Baltic Sea region is tritium. After tritium, the most abundantly discharged nuclides are caesium-137, strontium-90 and cobalt-60 consisting more than 95% of the cumulative decay corrected discharges of the other radionuclides except tritium in the long term. The importance of tritium to radiation burden of people is minor, because of the low energy emitted by the radionuclide. Due to the higher significance of caesium-137, strontium-90 and cobalt-60 to the radiation doses to man, the annual discharges of these three radionuclides are considered in the indicator fact sheet.
Results and assessment
Discharge data of all nuclear power plants and other nuclear installations operating in the Baltic Sea drainage area have been reported by the Contracting Parties to the HELCOM MORS Discharge Data Register since the mid 1970s, i.e. since the operation of the nuclear power plants was started in the area. Discharge data are reported annually from 10 power plants and 4 other installations to the register.
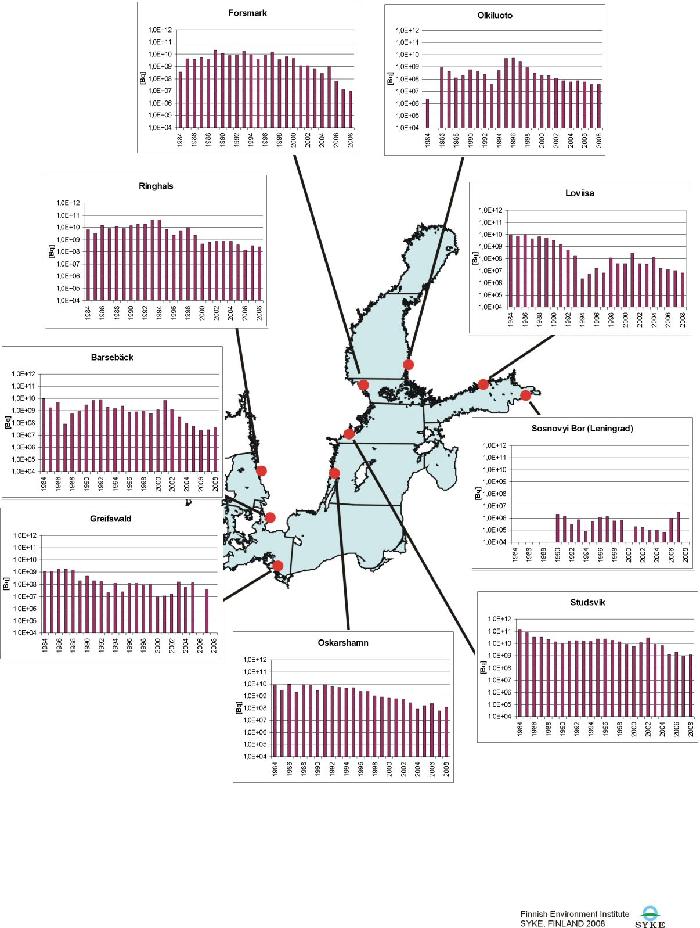
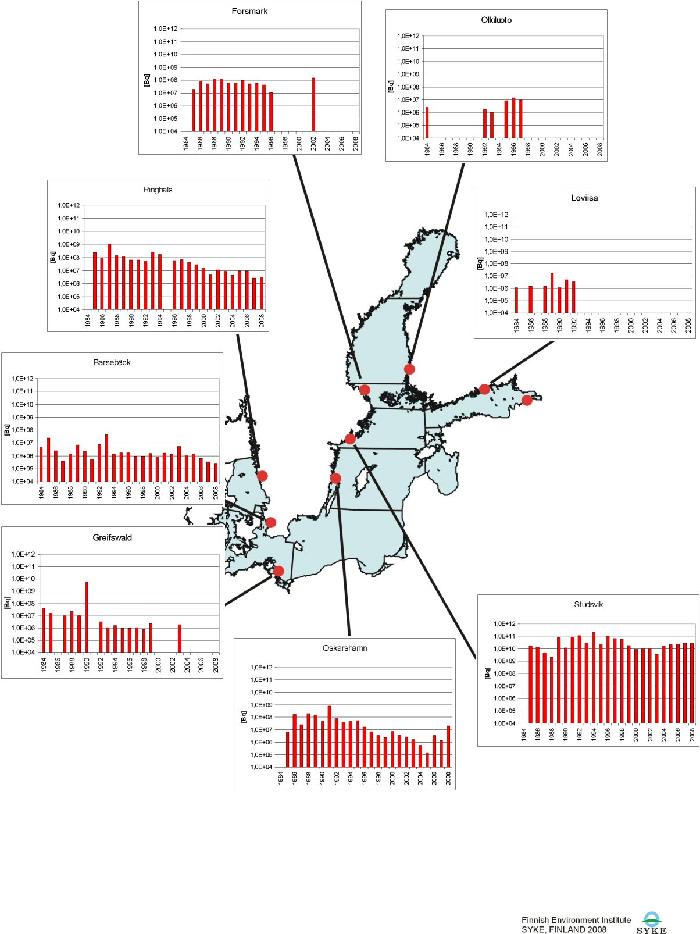
In 2008, the total discharges of caesium-137, strontium-90 and cobalt-60 into the Baltic Sea were 1.7, 27 and 3.2 GBq, respectively. In general, there has been a clear decreasing trend in the discharges of caesium-137, strontium-90 and cobalt-60 from the local nuclear power plants into the Baltic Sea during the last decade (Figs. 1-3). In each case, the annual discharges have been only few percent of the permitted discharge limits.
The local discharges as a source of radioactivity in the Baltic Sea are of minor importance. The most important sources with respect to the present total inventory of artificial radionuclides in the Baltic Sea have been the fallout from the Chernobyl accident in 1986, the fallout from atmospheric nuclear weapons tests in the 1950s and 1960s, and the discharges from nuclear reprocessing plants in the Western Europe. A small share of the discharges from the reprocessing plants has been transported into the Baltic Sea among the sea currents through the Danish Straits. These three sources represent 82, 14 and 4% of the total input of caesium-137 into the Baltic Sea, respectively, while the share of the local discharges has been only 0.03%. With respect to strontium-90, the share of the local discharges has been 0.1%.
Fig. 1. Annual liquid discharges of caesium-137 from nuclear power plants and other nuclear facilities into the Baltic Sea in 1984-2008 (Note: logarithmic scales in the graphs).
Fig. 2. Annual liquid discharges of strontium-90 from nuclear power plants and other nuclear facilities into the Baltic Sea in 1984-2008 (Note: logarithmic scales in the graphs).
Fig. 3. Annual liquid discharges of cobalt-60 from nuclear power plants and other nuclear facilities into the Baltic Sea in 1984-2008 (Note: logarithmic scales in the graphs).
Table 1.
Annual caesium-137 discharges from different installations in 1984-2008 [Bq].
| YEAR | Loviisa | Olkiluoto | Greifswald | Sosnovyi Bor (Leningrad) | Forsmark | Studsvik | Oskarshamn | Barsebäck | Ringhals |
| 1984 | 9,30E+09 | 2,30E+06 | 1,13E+09 | 3,70E+08 | 1,50E+11 | 8,62E+09 | 9,23E+09 | 6,15E+09 | |
| 1985 | 7,00E+09 | 1,20E+09 | 4,40E+09 | 8,60E+10 | 3,20E+09 | 1,80E+09 | 3,40E+09 | ||
| 1986 | 1,00E+10 | 8,80E+08 | 1,80E+09 | 4,00E+09 | 3,30E+10 | 9,90E+09 | 5,00E+09 | 1,50E+10 | |
| 1987 | 4,60E+09 | 4,20E+08 | 1,84E+09 | 5,60E+09 | 3,30E+10 | 2,10E+09 | 8,50E+07 | 7,70E+09 | |
| 1988 | 6,90E+09 | 1,30E+08 | 1,58E+09 | 3,70E+09 | 2,20E+10 | 9,00E+09 | 5,50E+08 | 1,20E+10 | |
| 1989 | 5,30E+09 | 2,00E+08 | 2,02E+08 | 2,30E+10 | 1,40E+10 | 8,40E+09 | 1,00E+09 | 8,20E+09 | |
| 1990 | 3,30E+09 | 6,10E+08 | 4,60E+08 | 2,10E+06 | 1,20E+10 | 1,10E+10 | 2,80E+09 | 3,20E+09 | 1,40E+10 |
| 1991 | 1,50E+09 | 4,80E+08 | 1,90E+08 | 1,30E+06 | 7,90E+09 | 1,60E+10 | 8,80E+09 | 6,70E+09 | 1,90E+10 |
| 1992 | 5,10E+08 | 2,40E+08 | 1,70E+08 | 2,90E+05 | 8,70E+09 | 1,80E+10 | 6,70E+09 | 7,90E+09 | 1,80E+10 |
| 1993 | 1,90E+08 | 3,70E+07 | 2,20E+07 | 7,40E+05 | 1,90E+10 | 1,70E+10 | 5,50E+09 | 2,00E+09 | 4,20E+10 |
| 1994 | 2,30E+06 | 5,10E+08 | 1,18E+08 | 7,80E+04 | 9,30E+09 | 1,50E+10 | 4,60E+09 | 1,50E+09 | 4,10E+10 |
| 1995 | 5,60E+06 | 4,90E+09 | 2,51E+07 | 5,60E+05 | 3,72E+09 | 2,42E+10 | 4,92E+09 | 2,48E+09 | 7,00E+09 |
| 1996 | 1,61E+07 | 5,25E+09 | 1,24E+08 | 1,20E+06 | 8,49E+09 | 2,41E+10 | 2,41E+09 | 7,40E+08 | 2,32E+09 |
| 1997 | 6,70E+06 | 2,80E+09 | 1,20E+08 | 1,36E+06 | 1,50E+10 | 1,90E+10 | 2,38E+09 | 8,30E+08 | 5,48E+09 |
| 1998 | 1,20E+08 | 8,80E+08 | 9,20E+07 | 6,03E+05 | 3,72E+09 | 1,40E+10 | 1,12E+09 | 1,00E+09 | 1,01E+10 |
| 1999 | 4,00E+07 | 3,20E+08 | 1,00E+08 | 6,40E+05 | 6,35E+09 | 8,41E+09 | 8,97E+08 | 6,10E+08 | 2,31E+09 |
| 2000 | 3,80E+07 | 2,10E+08 | 1,00E+07 | 7,22E+03 | 4,66E+09 | 6,04E+09 | 6,75E+08 | 1,20E+09 | 4,50E+08 |
| 2001 | 3,00E+08 | 1,90E+08 | 1,10E+07 | 1,98E+05 | 1,12E+09 | 1,20E+10 | 6,30E+08 | 6,97E+09 | 5,95E+08 |
| 2002 | 4,00E+07 | 1,20E+08 | 1,70E+07 | 1,66E+05 | 1,14E+09 | 3,00E+10 | 6,04E+08 | 1,22E+09 | 6,90E+08 |
| 2003 | 3,50E+07 | 7,60E+07 | 1,50E+08 | 1,03E+05 | 6,96E+08 | 8,57E+09 | 2,88E+08 | 3,26E+08 | 6,98E+08 |
| 2004 | 1,30E+08 | 6,20E+07 | 5,40E+07 | 1,05E+05 | 2,57E+08 | 7,03E+09 | 8,38E+07 | 9,98E+07 | 6,99E+08 |
| 2005 | 1,60E+07 | 7,80E+07 | 1,30E+08 | 6,66E+04 | 9,94E+08 | 1,33E+09 | 1,66E+08 | 5,41E+07 | 3,73E+08 |
| 2006 | 1,30E+07 | 6,20E+07 | 9,73E+05 | 6,76E+07 | 1,97E+09 | 2,35E+08 | 2,23E+07 | 1,32E+08 | |
| 2007 | 1,07E+07 | 3,85E+07 | 4,00E+07 | 3,21E+06 | 1,32E+07 | 9,68E+08 | 6,19E+07 | 2,66E+07 | 3,24E+08 |
| 2008 | 6,62E+06 | 3,61E+07 | 9,66E+06 | 1,23E+09 | 1,22E+08 | 4,00E+07 | 2,49E+08 |
Table 2.
Annual strontium-90 discharges from different installations in 1984-2008 [Bq].
| YEAR | Loviisa | Olkiluoto | Greifswald | Sosnovyi Bor (Leningrad) | Forsmark | Studsvik | Oskarshamn | Barsebäck | Ringhals |
| 1984 | 1,10E+06 | 2,50E+06 | 4,20E+07 | 4,90E+06 | |||||
| 1985 | 1,50E+07 | 2,00E+07 | 1,71E+10 | 6,50E+06 | 2,52E+07 | 2,50E+08 | |||
| 1986 | 1,50E+06 | 8,98E+07 | 1,33E+10 | 1,64E+08 | 2,57E+06 | 9,00E+07 | |||
| 1987 | 1,07E+07 | 5,56E+07 | 4,65E+09 | 2,55E+07 | 3,70E+05 | 1,10E+09 | |||
| 1988 | 1,60E+06 | 2,37E+07 | 1,36E+08 | 2,08E+09 | 2,00E+08 | 1,39E+06 | 1,40E+08 | ||
| 1989 | 1,60E+07 | 1,01E+07 | 1,36E+08 | 8,20E+10 | 1,45E+08 | 6,80E+06 | 1,10E+08 | ||
| 1990 | 1,10E+06 | 5,90E+09 | 6,34E+07 | 1,17E+10 | 4,77E+07 | 2,34E+06 | 6,50E+07 | ||
| 1991 | 4,90E+06 | 6,30E+07 | 8,60E+10 | 7,86E+08 | 5,20E+05 | 6,42E+07 | |||
| 1992 | 3,40E+06 | 1,80E+06 | 3,10E+06 | 1,00E+08 | 1,13E+11 | 8,05E+07 | 7,71E+06 | 5,23E+07 | |
| 1993 | 1,00E+06 | 1,10E+06 | 5,61E+07 | 2,96E+10 | 3,92E+07 | 4,50E+07 | 2,67E+08 | ||
| 1994 | 1,57E+06 | 6,00E+07 | 2,18E+11 | 4,68E+07 | 1,38E+06 | 1,71E+08 | |||
| 1995 | 8,40E+06 | 1,01E+06 | 4,40E+07 | 2,33E+10 | 5,37E+07 | 1,75E+06 | |||
| 1996 | 1,50E+07 | 9,00E+05 | 1,10E+07 | 1,10E+11 | 1,63E+07 | 1,80E+06 | 6,04E+07 | ||
| 1997 | 8,90E+06 | 1,10E+06 | 7,00E+10 | 7,04E+06 | 8,80E+05 | 6,66E+07 | |||
| 1998 | 7,50E+05 | 5,80E+10 | 3,42E+06 | 8,80E+05 | 4,51E+07 | ||||
| 1999 | 2,40E+06 | 1,89E+10 | 2,34E+06 | 1,50E+06 | 2,88E+07 | ||||
| 2000 | 9,13E+09 | 7,45E+06 | 8,57E+05 | 1,58E+07 | |||||
| 2001 | 2,70E+03 | 1,00E+10 | 3,78E+06 | 1,59E+06 | 5,25E+06 | ||||
| 2002 | 1,52E+08 | 1,00E+10 | 2,53E+06 | 1,34E+06 | 1,15E+07 | ||||
| 2003 | 1,90E+06 | 3,60E+09 | 1,61E+06 | 5,43E+06 | 8,38E+06 | ||||
| 2004 | 1,67E+10 | 5,78E+05 | 1,05E+06 | 4,38E+06 | |||||
| 2005 | 2,10E+10 | 1,41E+05 | 1,42E+06 | 9,14E+06 | |||||
| 2006 | 2,39E+10 | 3,49E+06 | 6,37E+05 | 9,03E+06 | |||||
| 2007 | 2,97E+10 | 1,41E+06 | 3,54E+05 | 2,67E+06 | |||||
| 2008 | 2,73E+10 | 2,10E+07 | 2,64E+05 | 3,02E+06 |
Table 3.
Annual cobalt-60 discharges from different installations in 1984-2008 [Bq].
| YEAR | Loviisa | Olkiluoto | Greifswald | Sosnovyi Bor (Leningrad) | Forsmark | Studsvik | Oskarshamn | Barsebäck | Ringhals |
| 1984 | 1,60E+09 | 5,70E+09 | 9,32E+08 | 9,26E+10 | 9,85E+10 | 3,54E+10 | 5,02E+10 | 1,20E+11 | |
| 1985 | 1,20E+09 | 4,50E+09 | 3,90E+08 | 2,00E+11 | 4,20E+10 | 2,90E+10 | 4,20E+10 | 5,50E+10 | |
| 1986 | 1,70E+09 | 5,40E+09 | 1,69E+09 | 3,70E+11 | 1,80E+10 | 3,60E+10 | 9,60E+10 | ||
| 1987 | 2,30E+09 | 9,00E+09 | 1,86E+09 | 1,90E+11 | 1,70E+10 | 3,00E+10 | 3,30E+10 | 6,50E+10 | |
| 1988 | 2,20E+09 | 6,40E+09 | 1,04E+09 | 2,20E+11 | 2,10E+09 | 2,30E+10 | 2,20E+10 | 5,40E+10 | |
| 1989 | 3,10E+09 | 1,30E+10 | 1,08E+09 | 1,70E+11 | 8,80E+08 | 2,50E+10 | 9,90E+09 | 7,60E+10 | |
| 1990 | 2,00E+09 | 1,60E+10 | 5,30E+08 | 1,80E+06 | 1,20E+11 | 2,10E+09 | 2,60E+10 | 2,00E+10 | 7,20E+10 |
| 1991 | 1,30E+09 | 8,40E+09 | 1,10E+08 | 1,20E+06 | 1,30E+11 | 2,60E+09 | 2,80E+10 | 2,70E+10 | 4,30E+10 |
| 1992 | 1,40E+09 | 7,30E+09 | 4,30E+07 | 6,60E+05 | 4,60E+10 | 1,60E+10 | 3,70E+10 | 5,10E+10 | 7,90E+10 |
| 1993 | 8,00E+08 | 3,60E+09 | 1,10E+08 | 1,00E+06 | 5,10E+10 | 5,60E+10 | 3,90E+10 | 1,50E+10 | 6,10E+10 |
| 1994 | 6,10E+07 | 5,90E+09 | 1,48E+07 | 4,90E+10 | 7,60E+09 | 3,10E+10 | 1,20E+10 | 8,70E+10 | |
| 1995 | 7,30E+06 | 8,10E+09 | 1,21E+07 | 5,90E+05 | 2,47E+10 | 4,94E+09 | 4,28E+10 | 2,97E+10 | 5,20E+10 |
| 1996 | 4,22E+06 | 7,40E+09 | 2,91E+07 | 1,60E+06 | 3,21E+10 | 1,63E+10 | 4,34E+10 | 5,20E+10 | 3,53E+10 |
| 1997 | 1,30E+06 | 3,60E+09 | 3,20E+07 | 1,60E+06 | 4,91E+10 | 3,25E+09 | 1,70E+10 | 2,00E+10 | 1,17E+11 |
| 1998 | 8,90E+08 | 9,00E+08 | 5,30E+07 | 6,66E+05 | 1,20E+10 | 1,34E+09 | 1,50E+10 | 9,20E+09 | 3,53E+10 |
| 1999 | 1,00E+07 | 7,90E+08 | 3,60E+07 | 4,44E+05 | 8,70E+09 | 7,69E+08 | 1,15E+10 | 1,50E+10 | 1,77E+10 |
| 2000 | 2,70E+06 | 5,00E+08 | 6,70E+06 | 2,25E+05 | 6,65E+09 | 1,81E+10 | 9,94E+09 | 1,80E+10 | 1,17E+10 |
| 2001 | 5,20E+08 | 3,00E+08 | 2,10E+06 | 2,15E+05 | 4,27E+09 | 4,87E+09 | 8,03E+09 | 3,07E+10 | 1,96E+10 |
| 2002 | 4,90E+05 | 4,80E+08 | 4,60E+05 | 6,22E+04 | 3,41E+09 | 2,46E+09 | 9,20E+09 | 1,76E+10 | 5,20E+09 |
| 2003 | 1,30E+06 | 2,80E+08 | 7,70E+06 | 4,97E+05 | 4,41E+09 | 7,09E+09 | 7,84E+09 | 9,50E+09 | 3,21E+09 |
| 2004 | 3,10E+08 | 2,40E+08 | 1,70E+06 | 8,05E+05 | 1,19E+09 | 1,31E+10 | 4,11E+09 | 4,96E+09 | 3,91E+09 |
| 2005 | 2,20E+07 | 3,20E+08 | 9,00E+06 | 3,01E+08 | 2,42E+09 | 2,19E+09 | 1,93E+09 | 3,28E+09 | |
| 2006 | 3,00E+07 | 3,00E+08 | 8,45E+05 | 6,62E+07 | 1,49E+09 | 1,10E+09 | 7,44E+08 | 1,31E+09 | |
| 2007 | 1,43E+07 | 2,12E+08 | 1,80E+07 | 5,33E+05 | 9,00E+06 | 1,10E+09 | 1,00E+09 | 2,74E+09 | 1,69E+09 |
| 2008 | 2,80E+07 | 1,49E+08 | 1,80E+07 | 3,86E+08 | 7,41E+08 | 1,03E+09 | 8,22E+08 |
References
HELCOM MORS Discharge Register
Ilus E and Ilus T. Sources of Radioactivity. In: Nielsen S.P., The radiological exposure of the population of the European Community to radioactivity in the Baltic Sea. Marina-Balt project. EUR 19200EN.
Lüning M and Ilus E. Sources of Radioactivity. In: HELCOM, Radioactivity in the Baltic Sea 1992-1998. Balt. Sea Environ. Proc. No. 85: 5-15.
Lüning M, Ilus E and Hermann J. Sources of Radioactive Substances in the Baltic Sea. In: HELCOM, Radioactivity in the Baltic Sea 1999-2006, HELCOM thematic assessment, Balt. Sea Environ. Proc. No. 117: 9-17.
Meta data
The data have been reported by the Contracting Parties of HELCOM to the HELCOM MORS Discharge Register. The data register is managed by STUK-Radiation and Nuclear Safety Authority, Finland.
The data is reported as total annual discharges into the aquatic environment and air (on voluntary basis) from each nuclear installation in bequerells (Bq). Only nuclides with a longer half-life than one week should be reported.
Quality information
The discharge data are reported by the nuclear installations to the National Authorities, which are responsible for validating the quality of the discharge data.
For reference purposes, please cite this indicator fact sheet as follows:
[Author’s name(s)], [Year]. [Indicator Fact Sheet title]. HELCOM Indicator Fact Sheets 2009. Online. [Date Viewed], http://www.helcom.fi/environment2/ifs/en_GB/cover/.
Last updated: 16 September 2009
