Atmospheric deposition of PCDD/Fs on the Baltic Sea
|
||||
Key message
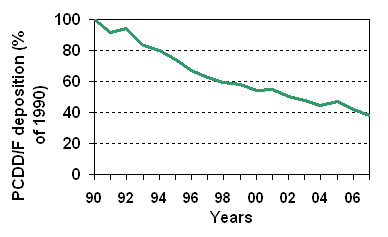
![]() Annual atmospheric deposition fluxes of PCDD/Fs over the Baltic Sea have decreased in period from 1990 to 2007 by 62%.
Annual atmospheric deposition fluxes of PCDD/Fs over the Baltic Sea have decreased in period from 1990 to 2007 by 62%.
Results and Assessment
Relevance of the indicator for describing the developments in the environment
This indicator shows the levels and trends in PCDD/F atmospheric deposition to the Baltic Sea. Levels of atmospheric deposition of PCDD/Fs represent the pressure of emission sources on the Baltic Sea aquatic environment.
Policy relevance and policy reference
HELCOM adopted a Recommendation in May 2001 for the cessation of hazardous substance discharges/emissions by 2020, with the ultimate aim of achieving concentrations in the environment near to background values for naturally occurring substances and close to zero for man-made synthetic substances.
Assessment
Annual atmospheric deposition fluxes of PCDD/Fs over the surface of the Baltic Sea have decreased in period 1990-2007 by 62% (Figure 1). The most significant change in PCDD/F atmospheric deposition can be noted for the Gulf of Bothnia (68%) and the Baltic Proper (63%). For other sub-basins the decrease of deposition varies from 51% to 61% (Table 1).
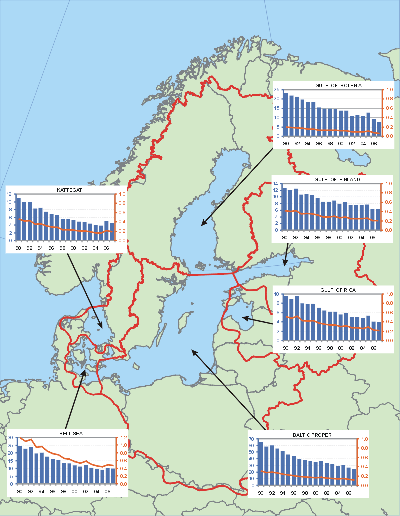
The highest level of PCDD/F atmospheric deposition fluxes (0.47 ng TEQ/m2/y) over the Baltic Sea in 2007 can be seen in its southern-western part (the Belt Sea) while the lowest one (0.06 ng TEQ/m2/y) over the Gulf of Bothnia. In other sub-basins the level of deposition fluxes varies from about 0.11 to 0.21 ng TEQ/m2/y. Among the HELCOM countries the most significant contributions to deposition over the Baltic Sea belong to Poland, Russia, and Denmark.

Figure 1: Computed annual atmospheric deposition of PCDD/Fs over the Baltic Sea for the period 1990-2007, (% of 1990).
Figure 2: Time-series of computed annual atmospheric deposition of PCDD/Fs over the six sub-basins of the Baltic Sea for the period 1990-2007 in g TEQ/year as bars (left axis) and deposition fluxes in ng TEQ/m2/year as lines (right axis). Note that different scales are used for deposition in g TEQ/year and the same scales for deposition fluxes. Click image to enlarge.
Data
Table 1. Computed annual atmospheric deposition of PCDD/Fs over the six Baltic Sea sub-basins for period 1990-2007. Units: g TEQ/year
| 1990 | 1991 | 1992 | 1993 | 1994 | 1995 | 1996 | 1997 | 1998 | 1999 | 2000 | 2001 | 2002 | 2003 | 2004 | 2005 | 2006 | 2007 | |
| GUB | 23.3 | 21.8 | 21.2 | 19.7 | 18.4 | 18.4 | 15.3 | 14.8 | 14.7 | 14.6 | 13.6 | 13.6 | 10.8 | 11.3 | 10.7 | 12.6 | 9.2 | 7.4 |
| BAP | 64.8 | 58.3 | 59.9 | 55.1 | 51.2 | 46.3 | 43.4 | 39.4 | 38.0 | 36.7 | 34.8 | 36.6 | 32.9 | 31.4 | 28.4 | 30.1 | 26.4 | 23.7 |
| GUF | 12.7 | 12.1 | 12.5 | 10.6 | 10.8 | 10.6 | 9.7 | 8.5 | 8.5 | 8.9 | 8.0 | 8.4 | 7.5 | 7.5 | 7.5 | 7.7 | 6.2 | 6.2 |
| GUR | 9.5 | 8.9 | 9.6 | 8.0 | 7.7 | 7.9 | 7.0 | 6.4 | 6.1 | 6.1 | 5.5 | 5.8 | 5.0 | 5.0 | 4.8 | 5.3 | 4.1 | 3.9 |
| BES | 24.5 | 22.4 | 23.6 | 19.4 | 19.9 | 17.3 | 16.0 | 15.3 | 13.4 | 13.0 | 11.8 | 10.9 | 12.0 | 10.3 | 9.4 | 9.0 | 10.0 | 9.7 |
| KAT | 10.8 | 9.8 | 9.9 | 8.2 | 8.4 | 7.4 | 6.7 | 6.5 | 5.4 | 5.4 | 5.2 | 4.9 | 4.7 | 4.4 | 3.9 | 3.8 | 5.0 | 4.5 |
| BAS | 146 | 133 | 137 | 121 | 116 | 108 | 98 | 91 | 86 | 85 | 79 | 80 | 73 | 70 | 65 | 69 | 61 | 55 |
Metadata
Technical information:
1. Source:
EMEP/MSC-E
2. Description of data:
Annual atmospheric deposition fluxes of PCDD/Fs were obtained using the latest version of MSCE-POP model developed at EMEP/MSC-E (Gusev et al., 2005). The latest available official emission data for the HELCOM countries have been used in the model computations. Emissions of PCDD/Fs for each year of this period were officially reported to the UN ECE Secretariat by most of the HELCOM countries. These data are available from the EMEP Centre on Emission Inventories and Projections (CEIP) (http://www.ceip.at/).
3. Geographical coverage:
Annual atmospheric deposition fluxes of PCDD/Fs were obtained for the European region.
4. Temporal coverage:
Timeseries of annual atmospheric deposition are available for the period 1990 – 2007.
5. Methodology and frequency of data collection:
Atmospheric input and source allocation budgets of PCDD/Fs to the Baltic Sea and its catchment area were computed using the latest version of MSCE-POP model. MSCE-POP is the regional-scale model operating within the EMEP region. This is a three-dimensional Eulerian model which includes processes of emission, advection, turbulent diffusion, wet and dry deposition, degradation, gaseous exchange with underlying surface, and inflow of pollutant into the model domain. Horizontal grid of the model is defined using stereographic projection with spatial resolution 50 km at 60º latitude. The description of EMEP horizontal grid system can be found in the internet (http://www.emep.int/grid/index.html). Vertical structure of the model consists of 15 non-uniform layers defined in the terrain-following s-coordinates and covers almost the whole troposphere. Detailed description of the model can be found in EMEP reports (Gusev et al., 2005) and in the Internet on EMEP web page (http://www.emep.int/) under the link to information on Persistent Organic Pollutants. Meteorological data used in the calculations for 1990-2007 were obtained using MM5 meteorological data preprocessor on the basis of the Re-analysis project data prepared by National Center for Environmental Predictions together with National Center of the Atmospheric Research (NCEP/NCAR) in the USA (http://wesley.ncep.noaa.gov/reanalysis.html) and meteorological analysis of European Centre for Medium-Range Weather Forecasts (ECMWF).
Results of model simulation of atmospheric transport and annual deposition of PCDD/Fs are provided on the regular basis annually two years in arrears on the basis of emission data officially submitted by Parties to CLRTAP Convention.
Quality information:
6. Strength and weakness:
Strength: annually updated information on atmospheric input of PCDD/Fs to the Baltic Sea and its sub-basins.
Weakness: uncertainties in officially submitted data on emissions of PCDD/Fs.
7. Uncertainty:
The MSCE-POP model results were compared with measurements of EMEP monitoring network [Gusev et al., 2006, Shatalov et al., 2005]. The model was evaluated through the comparison with available measurements during EMEP TFMM meetings held in 2005. It was concluded that the MSCE-POP model is suitable for the evaluation of the long range transboundary transport and deposition of POPs in Europe.
8. Further work required:
Further work is required on reducing uncertainties in emission data and modeling approaches used in MSCE-POP model.
References
Gusev A., I. Ilyin, L.Mantseva, O.Rozovskaya, V. Shatalov, O. Travnikov [2006] Progress in further development of MSCE-HM and MSCE-POP models (implementation of the model review recommendations. EMEP/MSC-E Technical Report 4/2006. (http://www.msceast.org/reps/4_2006.zip)
Gusev A., E. Mantseva, V. Shatalov, B.Strukov [2005] Regional multicompartment model MSCE-POP EMEP/MSC-E Technical Report 5/2005. (http://www.msceast.org/events/review/pop_description.html)
Shatalov V., Gusev A., Dutchak S., Holoubek I., Mantseva E., Rozovskaya O., Sweetman A., Strukov B. and N.Vulykh [2005] Modelling of POP Contamination in European Region: Evaluation of the Model Performance. Technical Report 7/2005. (http://www.msceast.org/reps/7_2005.zip).
For reference purposes, please cite this indicator fact sheet as follows:
[Author’s name(s)], [Year]. [Indicator Fact Sheet title]. HELCOM Indicator Fact Sheets 2009. Online. [Date Viewed], http://www.helcom.fi/environment2/ifs/en_GB/cover/.
Last updated: 10 September 2009


