Development of Sea Surface Temperature in the Baltic Sea in 2008
|
||||
Key message
The monthly mean sea surface temperatures of the entire year 2008 were higher than the long term mean values except the months August and September. This contributed to a further increase of the yearly mean temperature of the Baltic Sea. Particularly, the months February to May belonged to the warmest in the period 1990-2008. The maximum ice coverage was on 24 /25 March 2008. The maximum temperatures were observed on 31 July because a cooling started already on 1 August from the north. Regional particularities occurred due to long lasting upwelling processes which were partly visible in the monthly means and in the anomalies (June).
Background
Sea Surface Temperature (SST) derived from data of the Advanced Very High Resolution Radiometer (AVHRR) of the National Oceanic and Atmospheric Administration (NOAA) weather satellites were provided by the German Federal Maritime and Hydrographic Agency Hamburg (BSH). The BSH operates a SeaSpace HRPT (High Resolution Picture Transmission) receiving station and receives data from two NOAA satellites. The SST data evaluation procedure is described by Siegel et al. (2007b). SST was implemented in the yearly assessment of the Baltic Sea since 1996 provided by the Baltic Sea Research Institute Warnemünde (Matthäus et al. 1997). Systematic studies on seasonal and inter-annual variations in SST are published by Siegel et al. (2006, 2008). This fact sheet is based on the results of the German assessment of the year 2008 (Nausch et al. 2009). The monthly means were used to investigate the seasonal development and inter-annual variations. The daily mean values were applied to retrieve particularities in the detailed thermal development. Anomalies were derived on the basis of the monthly mean SST of the year 2008 and the long-term averages of all months in the period 1990 - 2004.
Results and assessment
The yearly development of water temperature was always compared to air temperature of Warnemünde (Nausch et al. 2009). The cold sum of air temperature showed that the winter 2007/2008 as the year before belonged to the mildest since 50 years. The heat sum of the summer 2008 was with 195.5 K above the long-term average value (143.8 K) with main contributions of the months May to July. The heat sum of the month August and September were only slightly above the long-term means.
These particularities in air temperature were reflected also in the sea surface temperature. The anomalies of the monthly mean SST of the year 2008 are presented in Fig. 1.
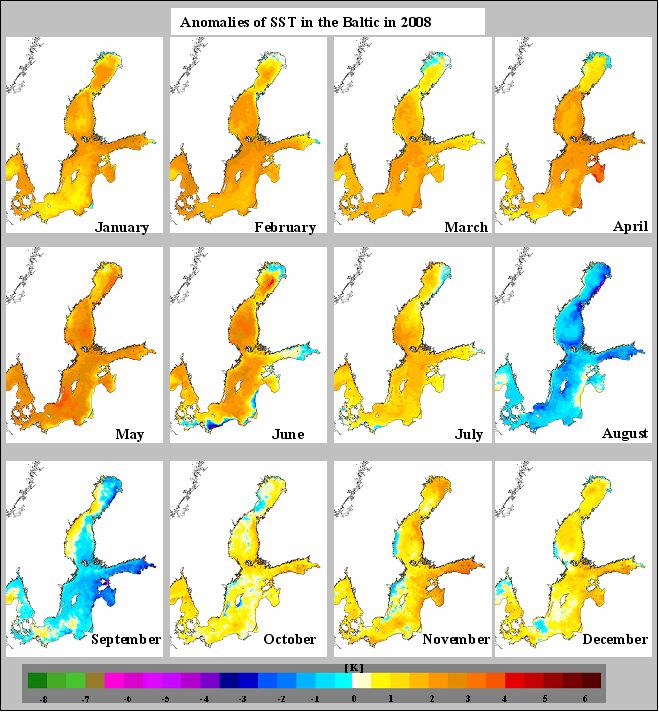
Fig. 1. SST- Anomalies of the monthly mean temperature of the Baltic Sea in 2008 referring to the long-term means 1990 - 2004
The SST in the period January to May were with 2-3 K above the long-term means in the entire Baltic Sea and reached maximum anomalies of +3.5 K in the southern parts of the western Gotland Sea and of the Bornholm Sea. In particular, the month June was characterised by strong spatial differences generated by upwelling processes along the coasts of Germany, Poland and of the Baltic Countries. After positive anomalies of +1 to +2 K in July the situation changed in August and September and slight negative anomalies were dominant in the most parts. In August intensive upwelling processes were produced in the northern Baltic Sea by easterly winds and in the southern Baltic Sea by westerly winds. In the months October, November, and December positive anomalies with up to +2 K dominated then again in far parts of the entire Baltic Sea. Only along the Swedish coast are cells of slightly negative anomalies, which were caused by upwelling due to westerly winds. This will be discussed in the detailed analysis.
The characteristics of the yearly 2008 come also very well in the seasonal course of the monthly mean temperature in the Arkona Sea and in the Gotland Sea to the expression, which are presented in Fig. 2 in comparison to the long-term monthly average values. The maximum temperatures were reached this year in July in both areas. The yearly minimum was shifted one month, into February in the Arkona Sea and into March in the Gotland Sea. The heating up in early spring started from the west expressed also in the average values of the subsequent months and particularly of May. In the months January to May the SST laid around +2 K over the long-term average values, in May the anomalies of the Arkona Sea reached over +3 K. The difference of approx. +1-2 K continued also in June and July, whereby the July means of the Arkona Sea was below that of the Gotland Sea caused by upwelling events. In September the mean temperatures were approx. 2 K higher in the Arkona Sea than in the Gotland Sea. That is surely a result of the cooling from the north. In the remaining months of the year the temperatures approached the long-term average values and were only slightly over them.
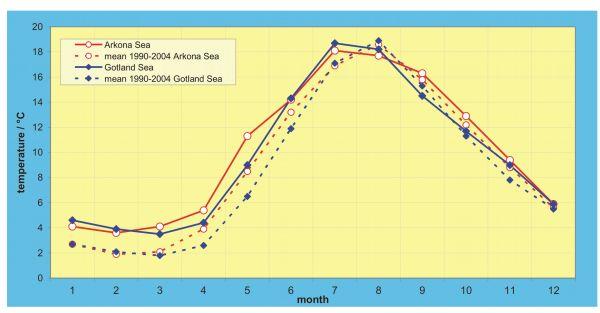
Fig. 2. Seasonal course of sea surface temperature (NOAA-SST) in the central Arkona- and Gotland Sea in 2008 in comparison to the mean values of the last 15 years (1990-2004)
The SST along the monitoring transect through the central basins of the Baltic Sea is presented in Figure 3 for February 2008 in comparison to the long-term mean value of the period 1990 – 2004 and to the previous years 2006 and 2007. In February 2008 the temperature was in the western Baltic and in the Baltic Proper between 3 and 4°C approximately 1 K lower than in February 2007 and more than 2 K higher than the long-term February average. The maximum ice extent of the year was observed rather late on 24-25 March 2008.
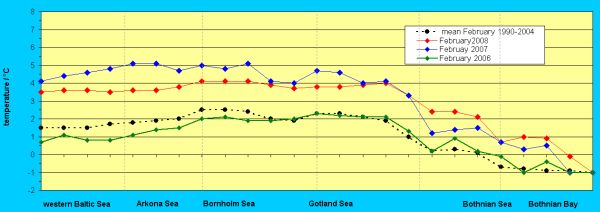
Fig. 3. Temperature distribution along the transect through the central basins of the Baltic Sea in February 2008 in comparison to the long-term mean value of 1990 – 2004 and to the previous years
July was characterized by two warming phases, up to 8 July and then from 20 July until the end of the month. The warming phase in the third decade of the month and the cooling beginning of August led to the maximum temperature of the year 2008 on 31 July (Fig. 4). In far parts of the central Baltic Sea temperatures between 20 and 22°C were reached and in the northern Baltic Sea they were only slightly lower.
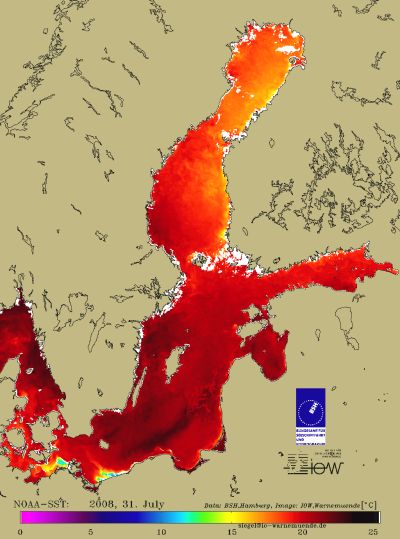
Fig. 4. Maximum SST of the year 2008 on 31 July
This led to monthly means along the transect through the central basins of the Baltic Sea as presented in Figure 5 (upper panel). The monthly means of the western Baltic Sea were appropriate only approx. +0.5K over the long-term mean values, in the Arkona Sea +1 K and in the northern Gotland Sea approx. +2 K. In the northern Baltic Sea the differences were again +1 K. In the Bothnian Bay the temperature decreased on 1 August within one day from 18-20°C to 14-17°C. A strong wind event on 4/5 August with speeds to over 20 m/s provided a strong mixing and a further cooling in the entire Baltic Sea. This situation remained until the end of August with temperatures of 16-18°C in the southern Baltic Sea, 15-17°C in the Gotlandsee, and 12-15°C in the northern Baltic Sea receive. Figure 4 (lower panel) shows the temperature distribution along the transect through the basins for the month August 2008 in the comparison to the means 1990 - 2004, to the previous year and to August 1998 the coldest since 1990. In the entire Baltic Sea the temperatures laid approx. 1-2 K under the long-term average values. In the western and central Baltic Sea the SST was similar as in the August of the previous year.
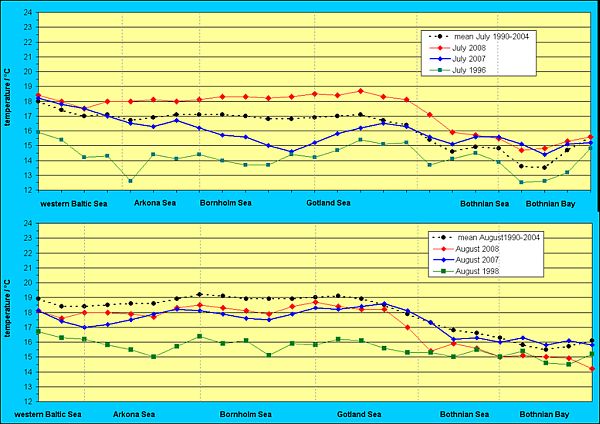
Fig. 5. Temperature distribution along the transect through the central basins of the Baltic Sea in July (upper panel) and August 2008 (lower panel) in comparison to the long-term mean value of 1990 – 2004, to the previous year and to August 1990 the coldest since 1990
References
Matthäus, W., D. Nehring, H.-U. Lass, G. Nausch, K. Nagel, H. Siegel, (1997). Hydrographisch-chemische Zustandseinschätzung der Ostsee 1996, Meereswissenschaftliche Berichte, Institut für Ostseeforschung Warnemünde, 24, 1-49.
Nausch, G., R. Feistel, H.U. Lass, K. Nagel, H. Siegel (2008): Hydro-graphisch-chemische Zustandseinschätzung der Ostsee 2007. Marine Science Report, Baltic Sea Research Institute Warnemünde, 72, 1-93.
Nausch, G., R. Feistel, H.U. Lass, K. Nagel, H. Siegel (2009): Hydro-graphisch-chemische Zustandseinschätzung der Ostsee 2008. Marine Science Report, Baltic Sea Research Institute Warnemünde, in press.
Siegel, H., M. Gerth, G. Tschersich (2006): Sea Surface Temperature development of the Baltic Sea in the period 1990-2004, Oceanologia, 48 (S) 119-131.
Siegel, H., M. Gerth, G. Tschersich, (2007). Sea surface temperature development and cyanobacteria in the Baltic Sea. Proceedings of Fifth Study Conference on Baltex, Kurressaare, 4-8 June 2007, International Baltex Secretariat Publication No. 38, ISSN 1681-6471, 180-181.
Siegel, H., M. Gerth, G. Tschersich, (2008). Satellite-derived Sea Surface Temperature for the period 1990-2005. In: State and Evolution of the Baltic Sea, 1952–2005, A Detailed 50-Year Survey of Meteorology and Climate, Physics, Chemistry, Biology, and Marine Environment. Ed. By R. Feistel, G. Nausch, N. Wasmund, Wiley 2008, 241-265.
Acknowledgement: The authors thank Mrs G. Tschersich and the BSH Hamburg for providing the NOAA AVHRR data.
For reference purposes, please cite this indicator fact sheet as follows:
[Author’s name(s)], [Year]. [Indicator Fact Sheet title]. HELCOM Indicator Fact Sheets 2009. Online. [Date Viewed], http://www.helcom.fi/environment2/ifs/en_GB/cover/.
Last updated: 1 March 2010
