Water transparency in the Baltic Sea between 1903 and 2009
|
||||
With extention: Transparency of the Baltic Sea during the growth season 2009 according to MERIS Satellite data
|
||||
Key messages
![]() Decrease in summer time water transparency was observed in all Baltic subregions over the last one hundred years. The decrease was most pronounced in the Northern Baltic Proper (from almost 9 m to 4 m) and the Gulf of Finland (from 8 m to 4 m).
Decrease in summer time water transparency was observed in all Baltic subregions over the last one hundred years. The decrease was most pronounced in the Northern Baltic Proper (from almost 9 m to 4 m) and the Gulf of Finland (from 8 m to 4 m).
![]() An increase in water transparency during the last 20 years was detected in Bornholm Sea an Arkona Sea.
An increase in water transparency during the last 20 years was detected in Bornholm Sea an Arkona Sea.
![]() In Kattegat and the Eastern Gotland Basin, the decreasing trend ceased during the past 20 years, and since then the water transparency remained in about the same level.
In Kattegat and the Eastern Gotland Basin, the decreasing trend ceased during the past 20 years, and since then the water transparency remained in about the same level.
![]() In the Bothnian Bay and the Bothnian Sea, the decrease seems to have ceased during recent years.
In the Bothnian Bay and the Bothnian Sea, the decrease seems to have ceased during recent years.
Results and assessment
Relevance of the indicator for describing developments in the environment
Water transparency is dependent on the amount of particulate matter and dissolved substances in the water. The material in the water may consist of inorganic suspended solids, plankton, humic substances and dissolved coloured substances. During the summer from June to September, the phytoplankton biomass is likely to have a high influence on water transparency, although especially in the Bothnian Bay humic substances are of importance. In summer time, bloom-forming filamentous cyanobacteria are abundant in other open sea areas except in the Bothnian Bay. Certain cyanobacteria are able to fix nitrogen and their growth is dependent on phosphate, but irradiance and water temperature also have an effect on their abundance. Changes in water transparency give an indication of changes in summer phytoplankton biomass.
Policy relevance and policy references
In the HELCOM system of ecological objectives (EcoOs), water transparency describes the EcoO 'water clarity'. It is also one of the HELCOM Baltic Sea Action Plan (BSAP) indicators for eutrophication. Water transparency is a supporting quality element in the EU Water Framework Directive. Turbidity, closely linked to Secchi depth, is in the indicative list of charachteristis to be followed in the EU Marine Strategy Framework Directive (Annex III).
Assessment
Decrease in summer time water transparency was observed in all Baltic sub-regions over the last one hundred years. The decrease was most pronounced in the northern Baltic Proper (from 9 m to 5 m) and the Gulf of Finland (from 8 m to 4 m). More recent decrease – that over the past 25 years – was most pronounced in the Western Gotland Basin, Northern Baltic Proper and the Gulf of Finland. On the other hand, in Kattegat and Eastern Gotland Basin the decreasing trend ceased during the past 20 years and since then the water transparency remained in about the same level. In Arkona Sea and Bornholm Sea the water transparency has increased during the last two decades.
The decreased summer time water transparency in the Baltic Proper and the Gulf of Finland is at least partly a result of the increase in phytoplankton biomass. In the Gulf of Finland, Bothnian Sea, Northern Baltic Proper, Gulf of Riga, Western Gotland Basin, Northern Gotland Basin, Bornholm Sea and Arkona Sea, summertime cyanobacterial blooms have become common during the last few decades.
Another reason for the decreased water transparency is no doubt changes in the input of organic as well as inorganic substances from land. This is probably the main reason in the Bothnian Bay, where phytoplankton growth is limited by low concentrations of phosphorus and heterotrophic production is of importance. However, it is evident also in the Bothnian Sea and the Gulf of Finland and possibly in other areas.
In the beginning of the 20th century the water transparency was considerably lower in the Gulf of Riga than in the other sub-regions investigated.
Kattegat is part of the transitional area between the high salinity North Sea and the brackish water Baltic Sea and water exchange in that area is frequent, which may be related to variations in water transparency.
Figures
Figure 1. Water transparency in June-September measured as Secchi depth (m) between years 1903 and 2009 in the different sub-regions of the Baltic Sea. Secchi depth observations (m) are plotted against the year of observation and the curves fitted with non-linear smoothing and shown with 95 % confidence intervals. The estimation of reference conditions provided by HELCOM Eutro Pro is shown as a red line, the target value with a blue line and the assessment status during 2001-06 as a gray solid line. The number of observations (n) is shown on each figure.
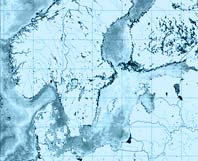
Figure 2. Water transparency observations made between 1903 and 2009 in the sub-regions (BB = Bothnian Bay, BS = Bothnian Sea, GoF = Gulf of Finland, NBP = Northern Baltic Proper, GR = Gulf of Riga, WGB = Western Gotland Basin, EGB = Eastern Gotland Basin, Ark = Arkona Basin and Bor = Bornholm Basin).
Further reading
Finni, T., Kononen, K., Olsonen, R. & Wallström, K. (2001): The history of cyanobacterial blooms in the Baltic Sea. – Ambio 30:172-178.
Fleming-Lehtinen V, Laamanen M, Kuosa H, Haahti H, Olsonen R (2008) Long-term development of inorganic nutrients and chlorophyll a in the open northern Baltic Sea. – Ambio 37:86-92.
Kahru, M., U. Horstmann, et al. (1994). "Satellite detection of increased cyanobacteria blooms in the Baltic Sea: Natural fluctuation or ecosystem change." Ambio 33: 469-472.
Launiainen, J., Vainio, J., Voipio, A., Pokki, J. & Niemimaa, J. (1989): Näkösyvyyden vaihteluista ja muuttumisesta pohjoisella Itämerellä (Long-term changes in the secchi depth in the northern Baltic Sea). – XIV Geofysiikan päivät. Geofysiikan seura. Helsinki, 117-121. (In Finnish, English summary.)
Lepistö, A., P. Kortelainen, et al. (2008). "Increased organic C and N leaching in a northern boreal river basin in Finland." Global biochemical cycles doi: 10.1029/2007GB003175: 1-10.
Niemi, J. (2009). "Concentrations of organic matter in the Bothnian rivers during the years 1913-31 and 1962-2006 (in Finnish)." Vesitalous 2: 37-41.
Poutanen, E.-L. & Nikkilä, K. (2001): Carotenoid pigments as tracers of cyanobacterial blooms in recent and post-glacial sediments of the Baltic Sea. - Ambio 30:179-183.
Sandén, P. & Håkansson, B. (1996): Long-term trends in Secchi depth in the Baltic Sea. – Limnol. Oceanogr. 41:346-351.
Metadata
Technical information
1. Data source: Secchi depth measurements were made during the research and monitoring cruises of the Finnish Institute of Marine Research between 1903 and 2008 and later by the Finnish Environment Institute (SYKE). The data is kept at the database of SYKE. In addition, observations from the ICES database were used as well as datasets provided by the Swedish Meteorological and Hydrological Institute, the Institute of Meteorology and Water Management in Poland, the Center of Marine Research in Lithuania and the Latvian Institute of Aquatic Ecology. At SYKE the contact person is Vivi Fleming-Lehtinen.
2. Description of data: The unit of the measurements is meter. Original purpose of the data was to give an indication of water clarity over long-time periods.
3. Geographical coverage: All regions of the Baltic Sea except for the Gulf of Riga.
4. Temporal coverage: From 1903 to 2009 except for the period from the 1940’s to the beginning of the 1970’s when observations are scarce due to the second world war.
5. Methodology and frequency of data collection: Measurements have been made on irregular research cruises and during monitoring cruises.
6. Methodology of data manipulation: Months of June, July, August and September were chosen to represent the period of abundant occurrence of cyanobacteria on the basis of monitoring data of Alg@line. Data originating from the coastal zones was removed from the data sets in order to have ecologically as homogenic regions as possible. Data from the beginning of the century that was produced using a 0.6 m diameter Secchi disk and a water viewer was corrected according to Launiainen et al. (1989). The Secchi depth data from each sub-region was plotted against the observation year and a non-linear smoothing curve was fitted to the plot. This technique estimates the local fit of the curve. The 95 % confidence intervals of the curve were estimated on the basis of standard error of ± 2 of the curve estimation.
The reference conditions for the Baltic sub regions were determined by combining information achieved from the means of the data collected between 1905 and 1910 and the value of the smoothing curve before 1940. The target value was set at a 25% interval from the reference conditions. All values are used as tools for an eutrophication assessment for the Baltic Sea in the Helcom Eutro Pro project.
7. Strength and weaknesses of data: Secchi depth is one of the few parameters on which there is data from a long time period. Practically the method is unchanged. Technically Secchi depth measurement is simple, cheap and easy to do. The temporal and spatial coverage of the data is not even, and data is lacking from certain time periods, such as that from the 1940’s to the beginning of the 1970’s. In addition, timing of the measurements in relation to the cyanobacterial biomass maximum may have an effect on the results especially if the amount of data is low.
8. Reliability, accuracy, robustness, uncertainty (at data level): Interpretation of the data ought to be done over long time periods (minimum of ten years).
9. Further work required (for data level and indicator level): The indicator will be updated annually with data collected from as many temporal and spatial points as possible in each of the regions. In order to resolve the significance of Secchi depth as a eutrophication parameter, the roles of the parameters affecting water transparency should be thoroughly investigated in the Baltic.
For reference purposes, please cite this indicator fact sheet as follows:
[Author’s name(s)], [Year]. [Indicator Fact Sheet title]. HELCOM Indicator Fact Sheets 2009. Online. [Date Viewed], http://www.helcom.fi/environment2/ifs/en_GB/cover/.
Last updated: 15 December 2009


