You are searching within the geographical region Global.
Other related regions to search.
Your query returned 574 graphics.
Results 151 - 165
Other related regions to search.
Your query returned 574 graphics.
Results 151 - 165
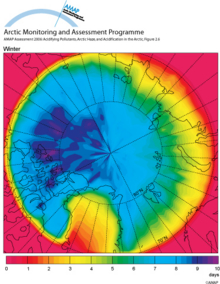
Mean arctic age of air in the lowest 100 m of the atmosphere (winter)Mean arctic age of air in the lowest 100 m of the atmosphere in January (winter) |
|
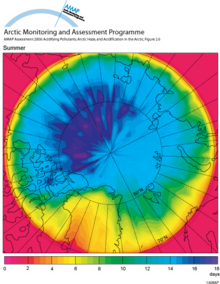
Mean arctic age of air in the lowest 100 m of the atmosphere (summer)Mean arctic age of air in the lowest 100 m of the atmosphere in July (summer) |
|
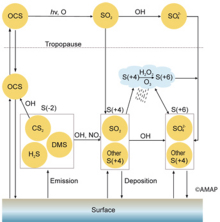
Atmospheric sulphur cycleAtmospheric sulphur cycle |
|
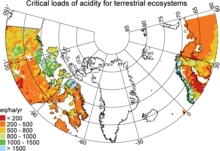
Critical loads of acidity for soilsCritical loads of acidity for terrestrial ecosystems in northern Europe and Canada north of 60 degrees N. |
|
Spatial distribution of global emissions of Hg in 1990 within a 1° x 1° grid The total emission inventory is 2144 tonnes HgSpatial distribution of global emissions of Hg in 1990 within a 1° x 1° grid The total emission inventory is 2144 tonnes Hg |

|
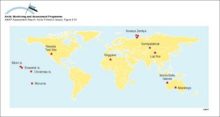
Sites where atmospheric testing of nuclear weapons has taken place since 1945Sites where atmospheric testing of nuclear weapons has taken place since 1945 |
|
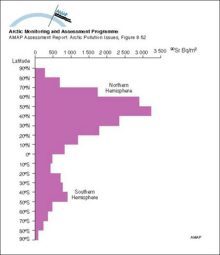
Integrated deposition density of 90SrIntegrated deposition density of 90Sr |
|
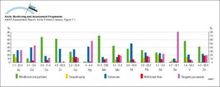
Global emissions of trace metals to the atmosphere from natural sources Numbers under the columns are the range of estimates of the emissions in thousands of tonnes per yearGlobal emissions of trace metals to the atmosphere from natural sources Numbers under the columns are the range of estimates of the emissions in thousands of tonnes per year |
|
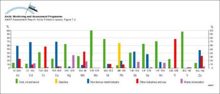
Global emissions of trace metals to the atmosphere at the beginning of the 1980s from anthropogenic sourcesGlobal emissions of trace metals to the atmosphere at the beginning of the 1980s from anthropogenic sources |
|
Global emissions of Pb to the atmosphere from various sources and source regions in 1989 Numbers under the columns are maximum estimates of the total emissions in tonnesGlobal emissions of Pb to the atmosphere from various sources and source regions in 1989 Numbers under the columns are maximum estimates of the total emissions in tonnes |

|
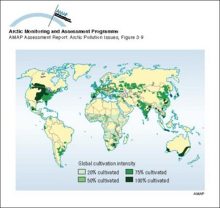
Global distribution of cultivation intensity based on a 1° x 1° latitude/longitude gridGlobal distribution of cultivation intensity based on a 1° x 1° latitude/longitude grid |
|
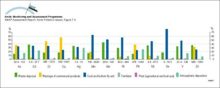
Global anthropogenic inputs of trace metals to soils at the beginning of the 1980s Numbers under the columns are the range of estimates of the inputs in thousands of tonnes per yearGlobal anthropogenic inputs of trace metals to soils at the beginning of the 1980s Numbers under the columns are the range of estimates of the inputs in thousands of tonnes per year |
|
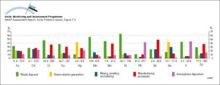
Global anthropogenic inputs of trace metals to aquatic ecosystems at the beginning of the 1980s Numbers under the columns are the range of estimates of the inputs in thousands of tonnes per yearGlobal anthropogenic inputs of trace metals to aquatic ecosystems at the beginning of the 1980s Numbers under the columns are the range of estimates of the inputs in thousands of tonnes per year |
|
Contributions from different continents and from different sources to the global emissions of Hg to the atmosphereContributions from different continents and from different sources to the global emissions of Hg to the atmosphere |

|
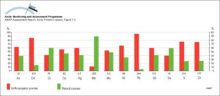
Comparison of global emissions of trace metals to the atmosphere from natural and anthropogenic sources in 1983 Numbers under the columns are the median values of estimates of total emissions in thousands of tonnes per yearComparison of global emissions of trace metals to the atmosphere from natural and anthropogenic sources in 1983 Numbers under the columns are the median values of estimates of total emissions in [..] |
|
Previous
1
2
3
4
5
6
7
8
9
10
11
12
13
14
15
16
17
18
19
20
21
22
23
24
25
26
27
28
29
30
31
32
33
34
35
36
37
38
39
Next
