|
Vertical distribution of Arctic haze in summer, winter, and the whole year Sulfur air concentrations and relative source-contribution (%) for different heights above the ground are shown The [..]
|

|
|
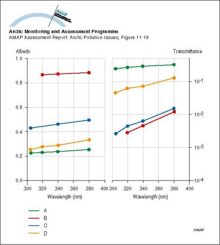
Ultraviolet albedo and transmittance values for (A) thin (03 m) bare sea; (B) cold 16 m thick ice with a 01 m deep snow cover in April; (C) bare 17 m thick ice in May; and, (D) ponded ice with 01 m of [..]
|
|
|
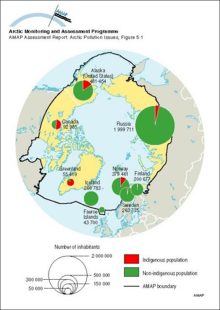
Total and indigenous populations of the Arctic, by Arctic area of each country (the data from Russia are for the indigenous minority population)
|
|
|
Time series of emissions of SO2 from European sources (Mylona 1993) and two major sources on the Kola Peninsula
|

|
|
The time series of (a) weekly-averaged non-seasalt (nss) sulfate aerosol at Alert, NWT, Canada, (b) monthly-averaged sulfate aerosol at Ny Ålesund, Norway, (c) weekly-averaged nitrate at Alert, and [..]
|

|
|
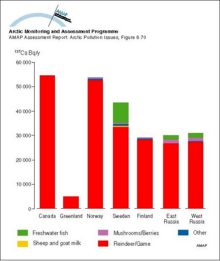
The relative contribution to the 137Cs content of the diet of the ‘selected’ population of various Arctic areas for the period 1990 to 1994
|
|
|
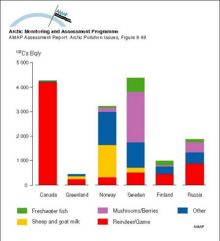
The relative contribution to the 137Cs content of the diet of the ‘average’ population of various Arctic areas for the period 1990 to 1994
|
|
|
The relationship between response levels of biological organization and the toxicological relevance and time scale of responses
|

|
|
The predicted (1988) average surface air sulfur dioxide concentrations in the Arctic
|

|
|
The predicted (1988) average surface air sulfate concentrations in the Arctic
|

|
|
The hydrologic balance in the Arctic is highly dynamic on the seasonal time scale with large and rapid ice melts in the spring On land, this ice and snow melting results in large rapid floods and [..]
|

|
|
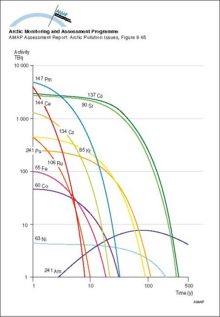
The changing inventory of major radionuclides in the Komsomolets reactor with time
|
|
|
Temporal variation in calculated reindeer Tag values for different Arctic regions
|

|
|
Temporal trends in concentrations of sum-HCH and toxaphene in Arctic air
|

|
|
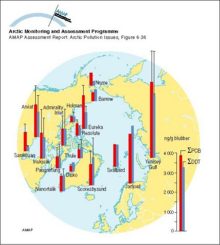
Sum-PCB and sum-DDT in ringed seal blubber (µg/g) Vertical bars denote standard deviation
|
|
Related regions to search:
Zoom out
Zoom in
