|
Model calculations of total (wet and dry) deposition estimates of sulfur for 1988
|

|
|
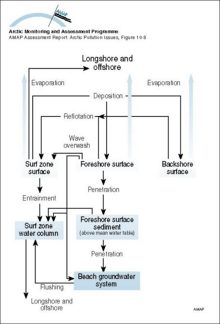
Mass transport pathways considered in the Coastal Zone Oil Spill Model (COZOIL), developed to simulate dynamic transport and weathering of oil on US Arctic coasts
|
|
|
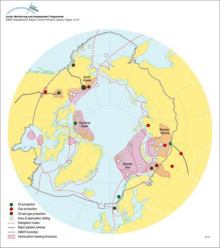
Major areas of oil and gas development and potential development in the Arctic, and major shipping routes and possible new routes through Arctic waters
|
|
|
MAGIC model results for the streamwater at Dalelva for the past 90 years and for three future scenarios assuming a 0%, 70%, and 95% reduction of the present sulfur deposition levels
|

|
|
Lower tropospheric temperatures since 1979, from satellite monitoring High variability is characteristic of the Arctic region due to its isolation from the moderating influences of warm, lower [..]
|

|
|
Lower tropospheric Arctic temperature trends (°C per decade, January 1979 to February 1996), as monitored by MSUs on polar orbiting satellites
|

|
|
Lower stratospheric temperature record since 1979
|

|
|
Lower stratospheric (ca 120-40 hPa) Arctic temperature trends (°C per decade, January 1979 to February 1996), as monitored by MSUs on polar orbiting satellites
|

|
|
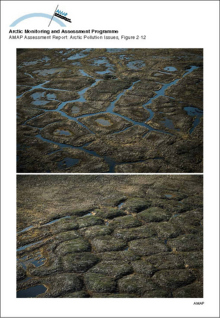
Low and high-center polygons
|
|
|
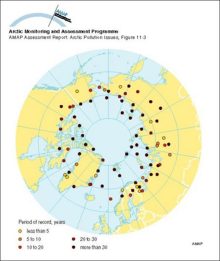
Locations of upper-air meteorological monitoring stations in the Arctic Meteorological station density for surface observations is greater for inland areas of the Arctic, while observations of any [..]
|
|
|
Locations of Arctic indigenous peoples
|
|
|
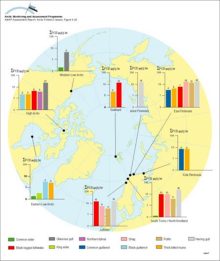
Levels of PCBs in seabird eggs (µg/g lw) Values written above bars are actual mean concentrations Wet weight means are given in Annex Table 6A16
|
|
|
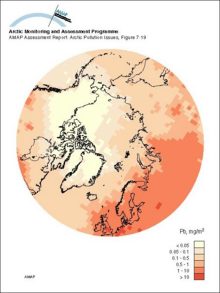
Lead deposition as modeled by the updated (1996) hemispheric EMEP transport model in a simulation for the reference year 1988
|
|
|
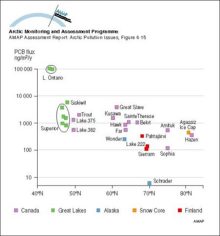
Latitudinal fluxes of sum-PCB in dated sediment cores from 25 locations including 13 Arctic locations (in Canada, Finland, and Alaska)
|
|
|
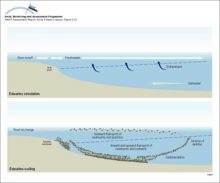
Illustration of water, sediment and nutrient cycling in estuaries Freshwater flows outward, transporting sediments, plankton and also contaminants Material that sinks into the inflowing seawater may [..]
|
|
Related regions to search:
Zoom out
Zoom in
