|
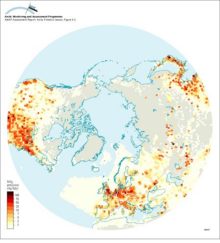
Anthropogenic NOx emissions for 1985 north of 30°N
|
|
|
An example of a type 2 ozone anomaly, showing levels of ozone depletion relative to the long-term mean
|

|
|
An example of a positive feedback loop Warming leads to a decrease in sea ice cover which in turn leads to a decrease in albedo over the ocean, the result of which is further warming and further [..]
|

|
|
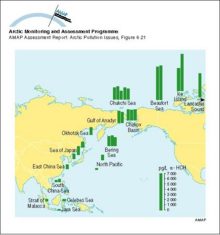
alpha-HCH (ng/L) in seawater: an illustration of the cold condensation effect
|
|
|
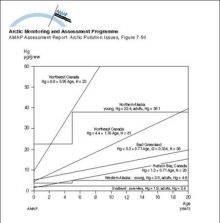
Age accumulation of Hg in liver of polar bears from different Arctic regions
|
|
|
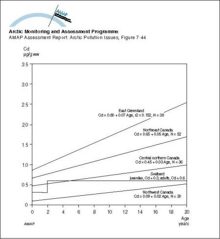
Age accumulation of Cd in liver of polar bears from different Arctic regions
|
|
|
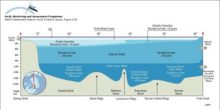
A schematic representation of the three-layer structure of the Arctic Ocean, with the Arctic Surface Layer above the Atlantic Water and Arctic Deep Water The residence time for the different water [..]
|
|
|
A schematic of the three-level thermodynamic snow ice system model
|

|
|
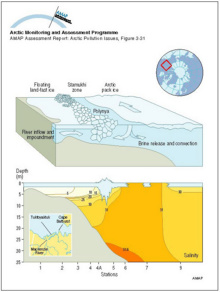
A schematic diagram showing the inflow from the Mackenzie River trapped in the nearshore zone beneath the landfast ice Beyond the stamukhi zone, intermittent opening and refreezing in the flaw lead [..]
|
|
|
A comparison of the structures of the Bergen, Toronto, and Combined zonally-averaged global models
|
|
|
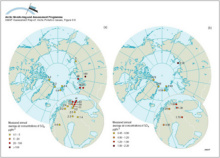
(a) Yearly average sulfur dioxide air concentration measurements in the Arctic, (b) Yearly average sulfate air concentration measurements in the Arctic
|
|
|
(a) Vertical distribution of SOx (SO2 + SO42-) concentrations averaged over the area north of 75°N, and (b) contributions from the different sources
|

|
|
(a) The contribution from the different sources to the total deposition, averaged over the area north of 75°N from October 1990 to May 1994, (b) the calculated total monthly depositions of SOx [..]
|

|
|
(a) Critical loads of acidity expressed as sulfur (5th percentile presented for each grid) for lakes in northern Fennoscandia and surface waters on Svalbard, and (b) their exceedance (95th percentile)
|

|
|
Summer and winter visibility observations (for relative humidities less than 80%) for the period 1951 to 1993 in North America
|

|
Related regions to search:
Zoom out
Zoom in
