|
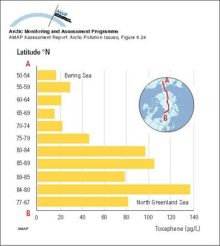
Measurements of toxaphene in surface water in the Bering Sea (1993) and the transpolar cruise (1994)
|
|
|
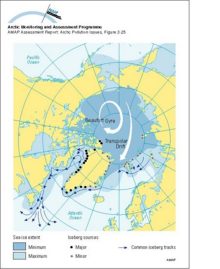
Main sources of icebergs and common iceberg drift trajectories The main ice circulation pattern follows the Transpolar Drift in the eastern Arctic and the Beaufort Gyre in the western Arctic (white [..]
|
|
|
Distribution of radioactivity (PCi/L) in the surface layer of the ocean after ten years of simulation of Preller's model Source locations are the Ob, Yenisey and Pechora Rivers, as well as Sellafield
|

|
|
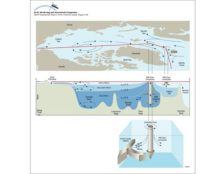
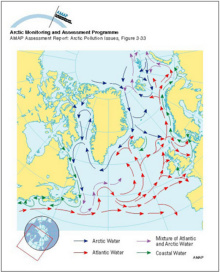
Circulation and water mass structure in the Arctic Ocean and Nordic Seas Mixing processes, such as brine formation, result in denser water that is transported off the shelves and into the deep basin
|
|
|
Average annual maximum and minimum sea ice extent The numbered lines show the expected time in years for the ice at that location to exit the Arctic Ocean through the Fram Strait, based on drifting [..]
|

|
|
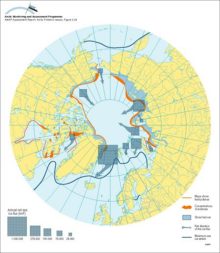
Approximate net sea ice exchange (see legend for key to arrow sizes), extent of shorefast ice and winter sea ice, and coastal polynyas and main polynya concentrations
|
|
|
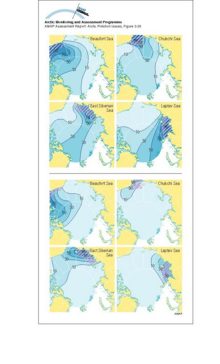
Above: contours of the asymptotic probability of ice formed in the hatched region moving into different parts of the Arctic Basin Below: contours of the asymptotic probability of ice moving from [..]
|
|
|
Major surface currents in the North Atlantic Ocean
|
|
|
The ten major point sources, and their emissions of As and Cd to the atmosphere, in Europe at the beginning of the 1990s Numbers above the columns are emissions in tonnes per year
|

|
|
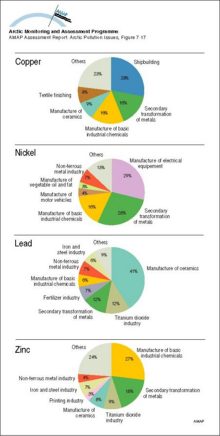
The relative importance of different branches of industry in discharges of Cu, Ni, Pb and Zn to the aquatic environment from major point sources in the European Community (EC)
|
|
|
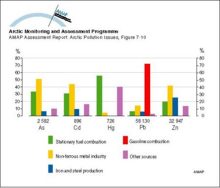
Emissions of selected heavy metals to the atmosphere in Europe at the beginning of the 1990s Numbers under the columns are emissions in tonnes per year
|
|
|
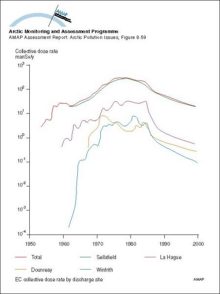
Collective dose rates from European nuclear fuel reprocessing plants based on releases up to 1986
|
|
|
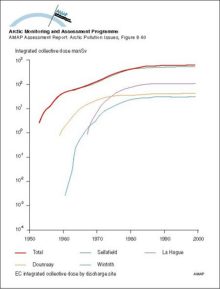
Collective dose commitment from nuclear fuel reprocessing activities
|
|
|
Changes with time in European atmospheric emissions of Cd, Pb and Zn
|

|
|
Estimates of emissions of As, Cd, Hg and Pb to the atmosphere from major source categories in the United States Numbers under the columns are emissions in tonnes per year
|

|
Related regions to search:
Zoom out
Zoom in
