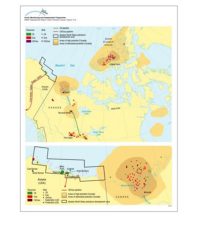
Major oil and gas development areas in Arctic Canada and on the Alaskan Beaufort Sea coast

Major oil and gas development areas in Arctic Canada and on the Alaskan Beaufort Sea coast

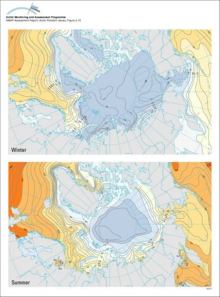
Winter and summer surface water temperatures in the Arctic Ocean and adjacent seas

Winter and summer surface water temperatures (°C) in the Arctic Ocean and adjacent seas
Winter and summer surface water temperatures in the Arctic Ocean and adjacent seas

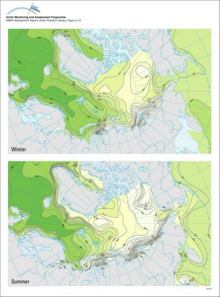
Winter and summer surface water salinity in the Arctic Ocean and adjacent seas

Winter and summer surface water salinity in the Arctic Ocean and adjacent seas

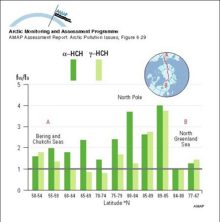
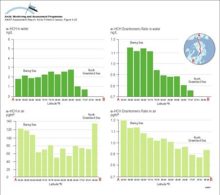
Water/air fugacity ratios (fw/fa) of alpha-HCH and gamma-HCH on a transect from the Bering Sea to the Greenland Sea in July and August 1994 A fugacity ratio of 1 indicates air-water equilibrium

Water/air fugacity ratios (fw/fa) of alpha-HCH and gamma-HCH on a transect from the Bering Sea to the Greenland Sea in July and August 1994 A fugacity ratio of 1 indicates air-water equilibrium

Vertically integrated tracer burden shown after 15 years Units are burden per unit surface area, normalized by cumulative release Bottom topography is in meters; a) no neptune, centered difference, and b) neptune, flux-corrected transport

Vertically integrated tracer burden shown after 15 years Units are burden per unit surface area, normalized by cumulative release Bottom topography is in meters; a) no neptune, centered difference, [..]
Vertically integrated tracer burden shown after 15 years Units are burden per unit surface area, normalized by cumulative release Bottom topography is in meters; a) no neptune, centered difference, and b) neptune, flux-corrected transport

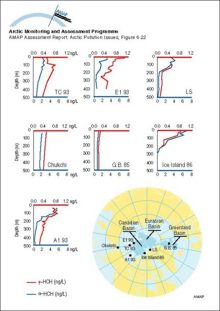
Vertical profiles of HCH for the Arctic Ocean

Vertical profiles of HCH for the Arctic Ocean

Trends in alpha-HCH and enantiomer ratios (ER) on a transect from the Bering Sea across the polar cap to the Greenland Sea during the Arctic Ocean Transect Study of July and August 1994

Trends in alpha-HCH and enantiomer ratios (ER) on a transect from the Bering Sea across the polar cap to the Greenland Sea during the Arctic Ocean Transect Study of July and August 1994

Tracer concentration on a vertical section (along Y=0 on Figure 346) after 15 years; a) no neptune, centered difference; b) neptune, flux-corrected transport; c,d) velocity normal to the section with positive "into" the page, negative "out" of the page;

Tracer concentration on a vertical section (along Y=0 on Figure 346) after 15 years; a) no neptune, centered difference; b) neptune, flux-corrected transport; c,d) velocity normal to the section with [..]
Tracer concentration on a vertical section (along Y=0 on Figure 346) after 15 years; a) no neptune, centered difference; b) neptune, flux-corrected transport; c,d) velocity normal to the section with positive "into" the page, negative "out" of the page;

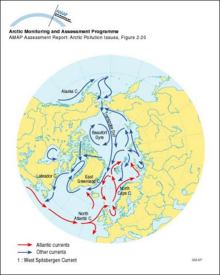
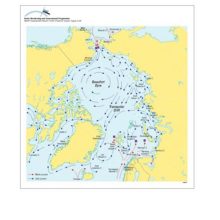
The predominant currents in the Arctic Ocean and their major routes around the basin edges of the Arctic

The predominant currents in the Arctic Ocean and their major routes around the basin edges of the Arctic

Surface ocean currents in the Arctic

Surface ocean currents in the Arctic

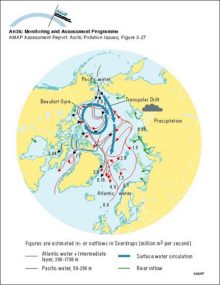
Surface currents in the Arctic region Square boxes indicate that the denser inflowing (Atlantic and Pacific) waters are submerging under the Polar Surface Water The continuation of these flows can be seen in Figure a03-27

Surface currents in the Arctic region Square boxes indicate that the denser inflowing (Atlantic and Pacific) waters are submerging under the Polar Surface Water The continuation of these flows can be [..]
Surface currents in the Arctic region Square boxes indicate that the denser inflowing (Atlantic and Pacific) waters are submerging under the Polar Surface Water The continuation of these flows can be seen in Figure a03-27

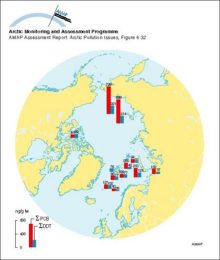
Sum-PCB and sum-DDT (ng/g lw) in Arctic cod liver, 1994-95

Sum-PCB and sum-DDT (ng/g lw) in Arctic cod liver, 1994-95

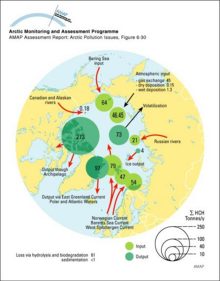
Sum-HCH budget for the Arctic Ocean (tonnes/y)

Sum-HCH budget for the Arctic Ocean (tonnes/y)

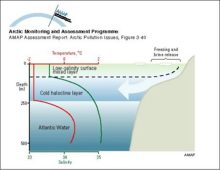
Schematic representation of the temperature and salinity structure of the upper Arctic Ocean and how the halocline layer is maintained by brine-rich water produced on the shelves

Schematic representation of the temperature and salinity structure of the upper Arctic Ocean and how the halocline layer is maintained by brine-rich water produced on the shelves

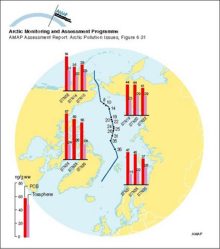
PCB and toxaphene (ng/g ww) in zooplankton from the transpolar cruise of the Arctic Ocean, July-September 1994

PCB and toxaphene (ng/g ww) in zooplankton from the transpolar cruise of the Arctic Ocean, July-September 1994


Related regions to search:
Number of graphics per country noted in paranthesis

Zoom out     Zoom in