Your query returned 574 graphics.
Results 196 - 210
Previous
1
2
3
4
5
6
7
8
9
10
11
12
13
14
15
16
17
18
19
20
21
22
23
24
25
26
27
28
29
30
31
32
33
34
35
36
Next
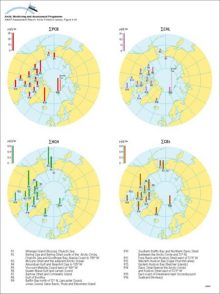
Organochlorine levels in polar bear adipose tissues (µg/g lw), adjusted to levels expected in 11-year-old males (after correction for age and sex), for sum-PCB, sum-CHL, sum-HCH, and sum-CBz, and in Arctic fox from Svalbard for sum-PCB and sum-CHLOrganochlorine levels in polar bear adipose tissues (µg/g lw), adjusted to levels expected in 11-year-old males (after correction for age and sex), for sum-PCB, sum-CHL, sum-HCH, and sum-CBz, and in [..] |
|
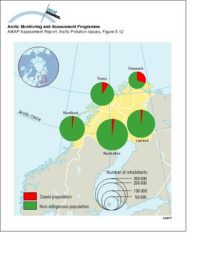
Total and Saami populations of Arctic areas of Fennoscandia (based on national census data)Total and Saami populations of Arctic areas of Fennoscandia (based on national census data) |
|
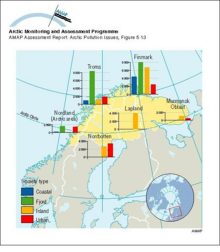
Calculated Saami population in the Arctic areas of the Saami region, by society type and regionCalculated Saami population in the Arctic areas of the Saami region, by society type and region |
|
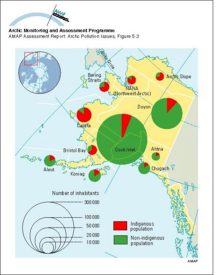
Total and indigenous populations of Arctic Alaska, by Native Regional Corporation regionTotal and indigenous populations of Arctic Alaska, by Native Regional Corporation region |
|
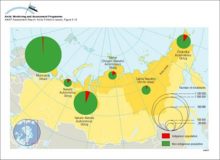
Total and indigenous minority populations in the Arctic area of the Russian Federation, by region, according to the 1989 CensusTotal and indigenous minority populations in the Arctic area of the Russian Federation, by region, according to the 1989 Census |
|
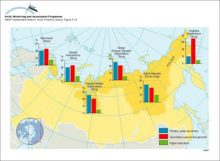
Age structure of the Arctic population of the Russian Federation, % of the total population, by region, 1993Age structure of the Arctic population of the Russian Federation, % of the total population, by region, 1993 |
|
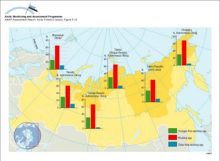
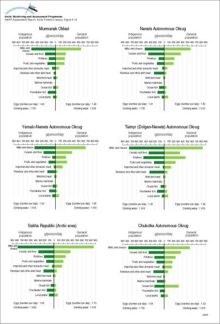
Average daily consumption of selected foods by indigenous and general populations in Arctic Russia, by region, g/person, in 1993Average daily consumption of selected foods by indigenous and general populations in Arctic Russia, by region, g/person, in 1993 |
|
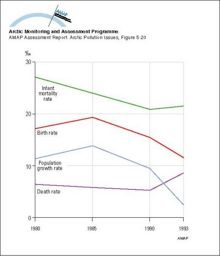
Rates of birth, death, infant mortality, and natural population growth (excluding in- and out-migration), averaged over all regions of Arctic Russia, per 1000 of population, 1980, 1985, 1990, 1993Rates of birth, death, infant mortality, and natural population growth (excluding in- and out-migration), averaged over all regions of Arctic Russia, per 1000 of population, 1980, 1985, 1990, 1993 |
|
Educational attainments of indigenous peoples in Arctic Russia, by regionEducational attainments of indigenous peoples in Arctic Russia, by region |
|
Temperature and salinity of the Labrador Sea The cold freshwater from the Arctic Ocean and Baffin Bay is seen above the continental shelfTemperature and salinity of the Labrador Sea The cold freshwater from the Arctic Ocean and Baffin Bay is seen above the continental shelf |

|
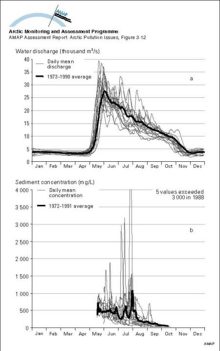
a) The annual (1973-1990) and mean annual hydrographs for the Mackenzie River above the Arctic Red River, NWT, Canada, indicating the dominance of the spring freshet in Maya) The annual (1973-1990) and mean annual hydrographs for the Mackenzie River above the Arctic Red River, NWT, Canada, indicating the dominance of the spring freshet in May |
|
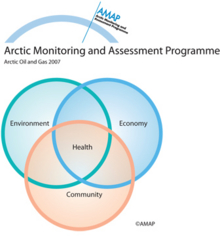
Holistic approach to assessment of health of the general populationHolistic approach to assessment of health of the general population |
|
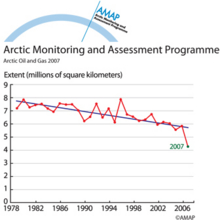
Recent observations of summer sea-ice extentRecent observations of summer sea-ice extent |
|
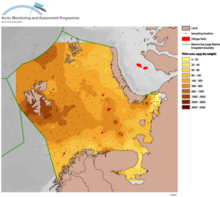
PAH concentration in bottom sediments of the Barents SeaPAH concentration (ng/g dry weight) in bottom sediments of the Barents Sea. Fine structure and hot spots shown on interpolated maps, such as this, should be viewed with caution, however the general [..] |
|
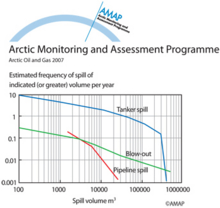
Relationship between frequency and volume of releases to the marine environment from different sources (worldwide)Relationship between frequency and volume of releases to the marine environment from different sources (worldwide) |
|
Previous
1
2
3
4
5
6
7
8
9
10
11
12
13
14
15
16
17
18
19
20
21
22
23
24
25
26
27
28
29
30
31
32
33
34
35
36
Next

water OR waste searches for either of these words
oceans AND biodiversity searches for blocks with both words
pollution NEAR water searches for blocks with either of these words, with them being closer ranks higher
"climate change" searches for this phrase