|
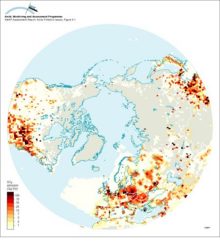
Spatial distribution of emissions of Pb within the 150 km x 150 km EMEP grid system for the area north of latitude 50° N in 1989
|

|
|
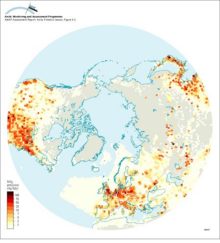
Anthropogenic SO2 emissions for 1985 north of 30°N
|
|
|
Anthropogenic NOx emissions for 1985 north of 30°N
|
|
|
Time series of emissions of SO2 from European sources (Mylona 1993) and two major sources on the Kola Peninsula
|

|
|
The time series of (a) weekly-averaged non-seasalt (nss) sulfate aerosol at Alert, NWT, Canada, (b) monthly-averaged sulfate aerosol at Ny Ålesund, Norway, (c) weekly-averaged nitrate at Alert, and [..]
|

|
|
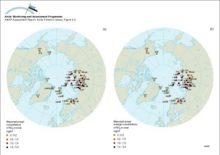
Concentrations of (a) sulfate and (b) nitrate in snow
|
|
|
(a) Vertical distribution of SOx (SO2 + SO42-) concentrations averaged over the area north of 75°N, and (b) contributions from the different sources
|

|
|
Scatterplots for comparisons between the average concentrations of SO2 and SO4 in air from October 1990 to December 1993 as monitored by the European Monitoring and Evaluation Programme (EMEP) and [..]
|

|
|
Summer and winter visibility observations (for relative humidities less than 80%) for the period 1951 to 1993 in North America
|

|
|
The time series of light scattering (?sp) and optical depth (?) at 500 nm at Barrow, Alaska
|

|
|
(a) The contribution from the different sources to the total deposition, averaged over the area north of 75°N from October 1990 to May 1994, (b) the calculated total monthly depositions of SOx [..]
|

|
|
Model calculations of total (wet and dry) deposition estimates of sulfur for 1988
|

|
|
Photograph of a submarine being provided with cooling water from a supply ship
|

|
|
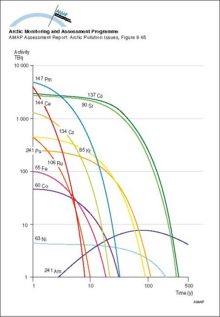
The changing inventory of major radionuclides in the Komsomolets reactor with time
|
|
|
Lower stratospheric temperature record since 1979
|

|

water OR waste searches for either of these words
oceans AND biodiversity searches for blocks with both words
pollution NEAR water searches for blocks with either of these words, with them being closer ranks higher
"climate change" searches for this phrase