Your query returned 574 graphics.
Results 331 - 345
Previous
1
2
3
4
5
6
7
8
9
10
11
12
13
14
15
16
17
18
19
20
21
22
23
24
25
26
27
28
29
30
31
32
33
34
35
36
Next
Seasonal and annual average surface temperature trends (°C per decade) over the northern hemisphereSeasonal and annual average surface temperature trends (°C per decade) over the northern hemisphere |

|
An example of a positive feedback loop Warming leads to a decrease in sea ice cover which in turn leads to a decrease in albedo over the ocean, the result of which is further warming and further decreases in the sea ice coverAn example of a positive feedback loop Warming leads to a decrease in sea ice cover which in turn leads to a decrease in albedo over the ocean, the result of which is further warming and further [..] |

|
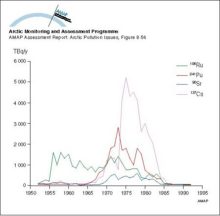
Discharges of principle beta-gamma emitters in liquid effluent from Sellafield, 1952-1992Discharges of principle beta-gamma emitters in liquid effluent from Sellafield, 1952-1992 |
|
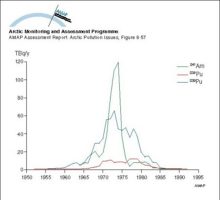
Discharges of principle alpha emitters in liquid effluent from Sellafield, 1952-1992Discharges of principle alpha emitters in liquid effluent from Sellafield, 1952-1992 |
|
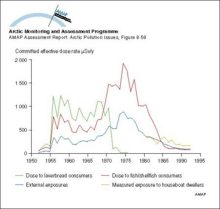
Comparison of doses to critical groups for Sellafield discharges from 1952 to 1993Comparison of doses to critical groups for Sellafield discharges from 1952 to 1993 |
|
Average activity concentrations of 137Cs in reindeer meat after 1990Average activity concentrations of 137Cs in reindeer meat after 1990 |
|
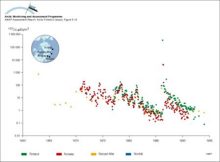
Changes with time in activity concentration of 90Sr in Russian and Finnish riversChanges with time in activity concentration of 90Sr in Russian and Finnish rivers |
|
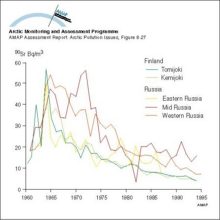
Changes with time in 137Cs activity concentration in air in Norway, Finland and RussiaChanges with time in 137Cs activity concentration in air in Norway, Finland and Russia |
|
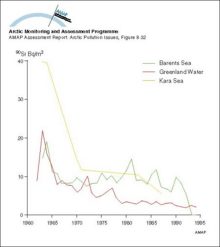
Changes with time in 90Sr activity concentrations in surface seawater from Greenland waters and the Barents and Kara SeasChanges with time in 90Sr activity concentrations in surface seawater from Greenland waters and the Barents and Kara Seas |
|
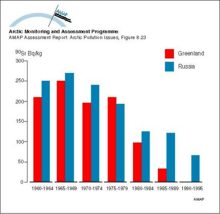
Changes with time in 90Sr activity concentration (5-year means) in lichens in Greenland and RussiaChanges with time in 90Sr activity concentration (5-year means) in lichens in Greenland and Russia |
|
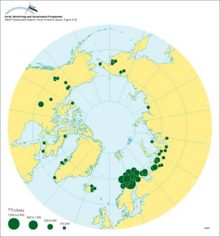
Cs-137 activity concentrations in surface seawater in 1994Cs-137 activity concentrations in surface seawater in 1994 |
|
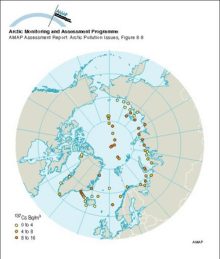
Concentrations of As and V in aerosols measured during concurrent measurement campaigns on Svalbard and two locations in Alaska during April 1986Concentrations of As and V in aerosols measured during concurrent measurement campaigns on Svalbard and two locations in Alaska during April 1986 |
|
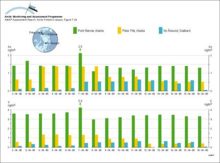
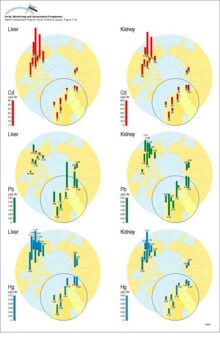
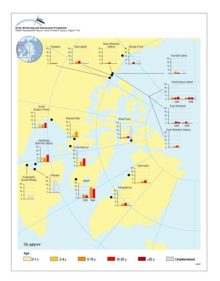
Circumpolar distribution of Cd, Pb and Hg levels in liver and kidney tissue of willow ptarmigan (Lagopus lagopus)Circumpolar distribution of Cd, Pb and Hg levels in liver and kidney tissue of willow ptarmigan (Lagopus lagopus) |
|
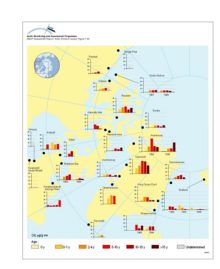
Distribution of Cd levels in liver tissue of ringed seal (Phoca hispida) of different ages Plots show selected data (geometric mean values) from Annex Table 7A15Distribution of Cd levels in liver tissue of ringed seal (Phoca hispida) of different ages Plots show selected data (geometric mean values) from Annex Table 7A15 |
|
Distribution of Cd levels in liver tissue of beluga whale (Delphinapterus leucas) of different ages Plots show selected data (geometric mean values) from Annex Table 7A15Distribution of Cd levels in liver tissue of beluga whale (Delphinapterus leucas) of different ages Plots show selected data (geometric mean values) from Annex Table 7A15 |
|
Previous
1
2
3
4
5
6
7
8
9
10
11
12
13
14
15
16
17
18
19
20
21
22
23
24
25
26
27
28
29
30
31
32
33
34
35
36
Next

water OR waste searches for either of these words
oceans AND biodiversity searches for blocks with both words
pollution NEAR water searches for blocks with either of these words, with them being closer ranks higher
"climate change" searches for this phrase