Your query returned 574 graphics.
Results 361 - 375
Previous
1
2
3
4
5
6
7
8
9
10
11
12
13
14
15
16
17
18
19
20
21
22
23
24
25
26
27
28
29
30
31
32
33
34
35
36
Next
Tracer concentration on a vertical section (along Y=0 on Figure 346) after 15 years; a) no neptune, centered difference; b) neptune, flux-corrected transport; c,d) velocity normal to the section with positive "into" the page, negative "out" of the page;Tracer concentration on a vertical section (along Y=0 on Figure 346) after 15 years; a) no neptune, centered difference; b) neptune, flux-corrected transport; c,d) velocity normal to the section with [..] |

|
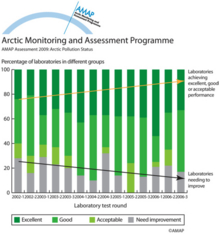
Environmental contaminants are typically found in minute quantitiesEnvironmental contaminants are typically found in minute quantities. Careful laboratory analyses are required to detect concentrations in the parts per million or parts per billion. A small error can [..] |
|
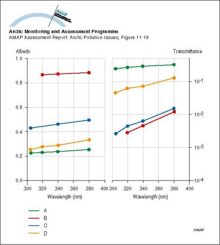
Ultraviolet albedo and transmittance values for (A) thin (03 m) bare sea; (B) cold 16 m thick ice with a 01 m deep snow cover in April; (C) bare 17 m thick ice in May; and, (D) ponded ice with 01 m of water over 15 m thick iceUltraviolet albedo and transmittance values for (A) thin (03 m) bare sea; (B) cold 16 m thick ice with a 01 m deep snow cover in April; (C) bare 17 m thick ice in May; and, (D) ponded ice with 01 m of [..] |
|
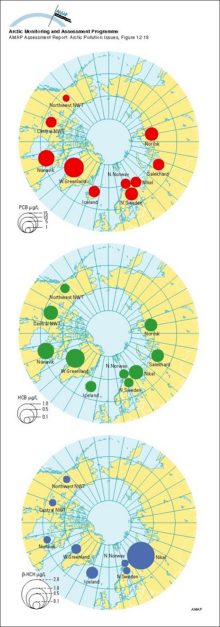
Geometric mean concentrations of PCB, HCB and B-HCH in maternal blood plasma; AMAP circumpolar study 1995, see Table 12A12Geometric mean concentrations of PCB, HCB and B-HCH in maternal blood plasma; AMAP circumpolar study 1995, see Table 12A12 |
|
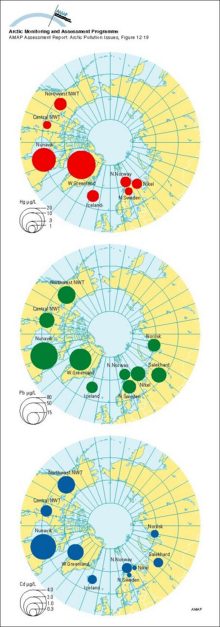
Geometric mean concentrations of mercury, lead and cadmium in maternal whole blood; AMAP circumpolar study 1994-95, see Table 12A13Geometric mean concentrations of mercury, lead and cadmium in maternal whole blood; AMAP circumpolar study 1994-95, see Table 12A13 |
|
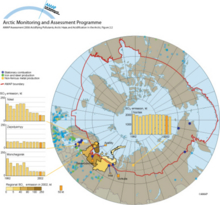
Sulfur dioxide emissions from metallurgical industry sourcesSulfur dioxide emissions from metallurgical industry sources and major coal-fired power plants in Russia (there are no significant point sources north of 60º N in other Arctic countries; pale coloured [..] |
|
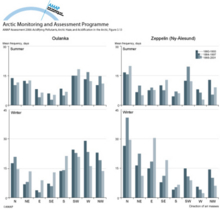
Frequency and variation in the direction of air massesFrequency and variation in the direction of air masses arriving at Oulanka and Zeppelin over 4-year periods during the 1990s |
|
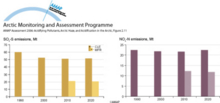
Projected total emissions of SOx-S and NOx-N between 1990 and 2020Projected total emissions of SOx-S and NOx-N between 1990 and 2020 |
|
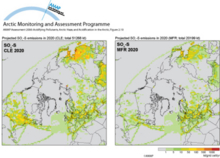
Projected SOx-S emissions in 2020 for the CLE and MFR emissions scenariosProjected SOx-S emissions in 2020 for the CLE and MFR emissions scenarios |
|
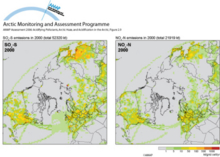
Estimated emissions of SOx-S and NOx-N in 2000Estimated emissions of SOx-S and NOx-N in 2000 |
|
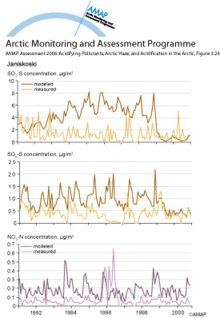
Time series of measured and modeled monthly concentrations of sulfur dioxide, sulfate, and nitrate at JaniskoskiTime series of measured and modeled monthly concentrations of sulfur dioxide, sulfate, and nitrate at Janiskoski, Russia |
|
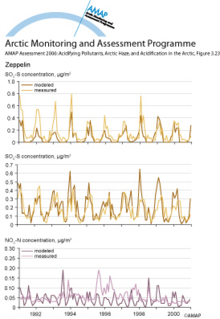
Time series of measured and modeled monthly concentrations of sulfur dioxide, sulfate, and nitrate at ZeppelinTime series of measured and modeled monthly concentrations of sulfur dioxide, sulfate, and nitrate at Zeppelin, Spitsbergen |
|
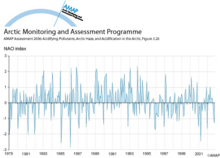
NAO index for the period 1979 to 2002NAO index for the period 1979 to 2002 |
|
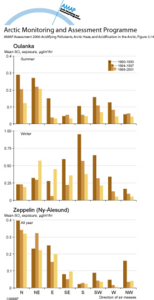
Mean exposure to sulfur dioxide at Oulanka and ZeppelinMean exposure to sulfur dioxide at Oulanka and Zeppelin in relation to the direction of air masses arriving at the stations in the 1990s |
|
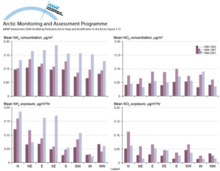
Mean concentration and exposure to nitrogen compounds at ZeppelinMean concentration and exposure to nitrogen compounds at Zeppelin in relation to the direction of air masses arriving at the station in the 1990s |
|
Previous
1
2
3
4
5
6
7
8
9
10
11
12
13
14
15
16
17
18
19
20
21
22
23
24
25
26
27
28
29
30
31
32
33
34
35
36
Next

water OR waste searches for either of these words
oceans AND biodiversity searches for blocks with both words
pollution NEAR water searches for blocks with either of these words, with them being closer ranks higher
"climate change" searches for this phrase