|
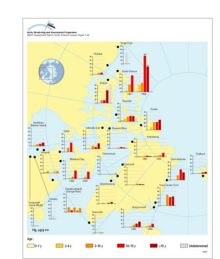
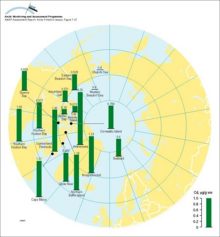
Distribution of Hg levels in liver tissue of ringed seal (Phoca hispida) of different ages Plots show selected data (geometric mean values) from Annex Table 7A15
|
|
|
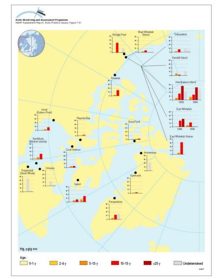
Distribution of Hg levels in liver tissue of beluga whale (Delphinapterus leucas) of different ages (years) Plots show selected data (geometric mean values) from Annex Table 7A15
|
|
|
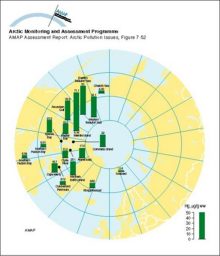
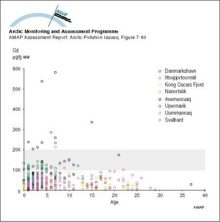
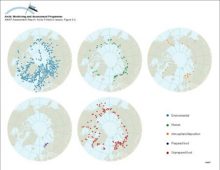
Distribution of Hg levels (age adjusted to 69 years, Svalbard adults) in liver tissue of polar bear (Ursus maritimus)
|
|
|
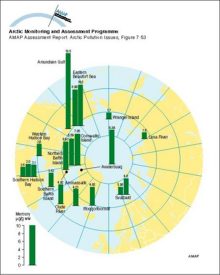
Distribution of Hg levels in hair of polar bear (Ursus maritimus)
|
|
|
Historical profiles of PCBs (trichloro- and all other) in slices from dated sediment cores in Alaska, Canada, and Finland Median age of each slice is given on the vertical axis The green lines [..]
|

|
|
Distribution of Cd levels (age adjusted to 69 years, Svalbard adult) in liver tissue of polar bear (Ursus maritimus)
|
|
|
Cadmium levels in kidney of adult ringed seals from Greenland and Svalbard Levels associated with potential for kidney damage are above 100-200 µg/g ww
|
|
|
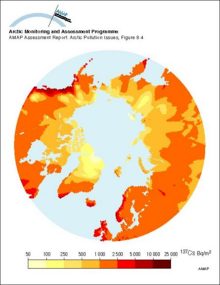
Estimated ground deposition of nuclear weapons fallout of 137Cs based on precipitation data, decay corrected to 1995
|
|
|
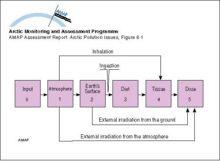
Compartment model used to assess doses from releases of radioactive materials to the atmosphere from nuclear testing
|
|
|
Geographical distribution of sample information in the AMAP radioactivity database
|
|
|
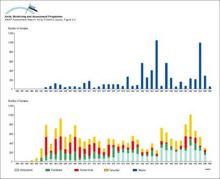
Available data in the AMAP radioactivity database as a function of time
|
|
|
Ranges and average values of 137Cs activity concentrations in food products, from data in the AMAP radioactivity database
|

|
|
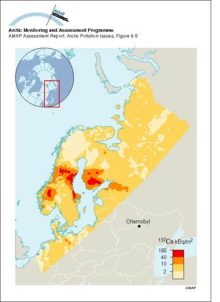
Ground deposition of 137Cs from the Chernoybl accident (values normalised to May 10, 1986)
|
|
|
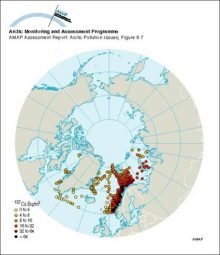
Cs-137 activity concentrations in surface seawater in 1979 and 1982
|
|
|
Seawater concentrations of 137Cs in the Barents and East Greenland Seas compared to the yearly releases from Sellafield
|

|

water OR waste searches for either of these words
oceans AND biodiversity searches for blocks with both words
pollution NEAR water searches for blocks with either of these words, with them being closer ranks higher
"climate change" searches for this phrase