Your query returned 574 graphics.
Results 16 - 30
Previous
1
2
3
4
5
6
7
8
9
10
11
12
13
14
15
16
17
18
19
20
21
22
23
24
25
26
27
28
29
30
31
32
33
34
35
36
Next
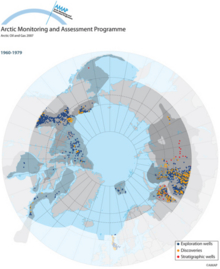
Expansion of exploration drilling activity in arctic oil and gas provinces. Locations of drilling 1960 to 1979Expansion of exploration drilling activity in arctic oil and gas provinces. Locations of drilling 1960 to 1979 |
|
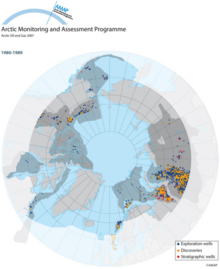
Expansion of exploration drilling activity in arctic oil and gas provinces. Locations of drilling 1980 to 1989Expansion of exploration drilling activity in arctic oil and gas provinces. Locations of drilling 1980 to 1989 |
|
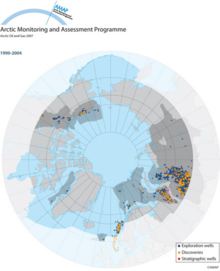
Expansion of exploration drilling activity in arctic oil and gas provinces. Locations of drilling 1990 to 2004Expansion of exploration drilling activity in arctic oil and gas provinces. Locations of drilling 1990 to 2004 |
|
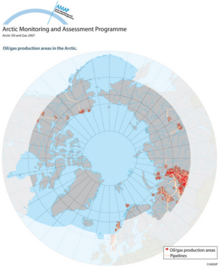
Oil/gas production areas in the ArcticOil/gas production areas in the Arctic |
|
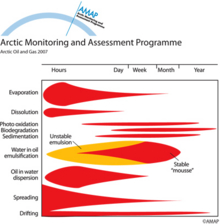
Fate of spilled oil - the most important weathering processes and their time windowsFate of spilled oil - the most important weathering processes and their time windows |
|
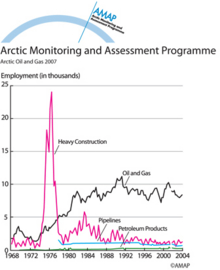
Alaska quarterly oil and gas employmentAlaska quarterly oil and gas employment, 1968-2004, showing the sharp spike in construction employment during the building of the Alaska Pipeline in the mid-1970s followed by more stable, but lower, [..] |
|
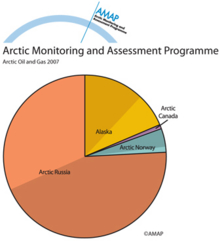
Pie charts showing original oil in place in the Arctic areas of the four Arctic producing countriesPie charts showing original oil in place (OOIP) in the Arctic areas of the four Arctic producing countries, and the cumulative production to date (part indicated by lighter shading, or %) |
|
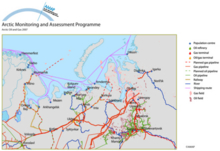
Map of main oil and gas transport routes from Russian Arctic production areasMap of main oil and gas transport routes from Russian Arctic production areas |
|
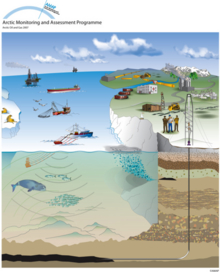
Generalized schematic diagram of oil and gas activitiesGeneralized schematic diagram of oil and gas activities |
|
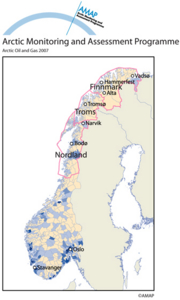
Distribution of business activity around Norway from oil and gasDistribution of business activity around Norway from oil and gas, shown in relative levels of spending by area |
|
Vertical distribution of Arctic haze in summer, winter, and the whole year Sulfur air concentrations and relative source-contribution (%) for different heights above the ground are shown The concentrations are averages over the Arctic area north of 70°NVertical distribution of Arctic haze in summer, winter, and the whole year Sulfur air concentrations and relative source-contribution (%) for different heights above the ground are shown The [..] |

|
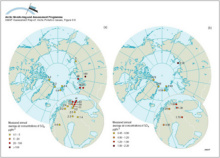
(a) Yearly average sulfur dioxide air concentration measurements in the Arctic, (b) Yearly average sulfate air concentration measurements in the Arctic(a) Yearly average sulfur dioxide air concentration measurements in the Arctic, (b) Yearly average sulfate air concentration measurements in the Arctic |
|
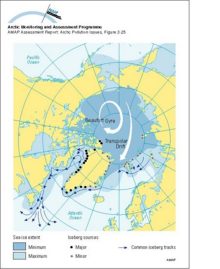
Main sources of icebergs and common iceberg drift trajectories The main ice circulation pattern follows the Transpolar Drift in the eastern Arctic and the Beaufort Gyre in the western Arctic (white arrows)Main sources of icebergs and common iceberg drift trajectories The main ice circulation pattern follows the Transpolar Drift in the eastern Arctic and the Beaufort Gyre in the western Arctic (white [..] |
|
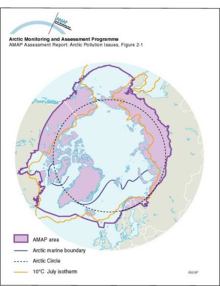
Arctic boundaries (physical)The Arctic as defined by temperature, and the Arctic marine boundary, also showing the boundary of the AMAP assessment area |
|
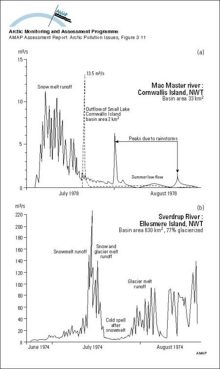
Hydrographs showing two types of streamflow regimes for Arctic rivers: a) Arctic nival regime and b) proglacial regimeHydrographs showing two types of streamflow regimes for Arctic rivers: a) Arctic nival regime and b) proglacial regime |
|
Previous
1
2
3
4
5
6
7
8
9
10
11
12
13
14
15
16
17
18
19
20
21
22
23
24
25
26
27
28
29
30
31
32
33
34
35
36
Next

water OR waste searches for either of these words
oceans AND biodiversity searches for blocks with both words
pollution NEAR water searches for blocks with either of these words, with them being closer ranks higher
"climate change" searches for this phrase