|
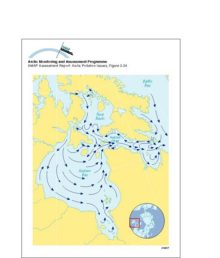
Surface currents in Hudson Bay, Hudson Strait and Foxe Basin
|
|
|
Transport of 90Sr, originating from Sellafield, along the coast of Norway The highest values are found in the Norwegian Coastal Current and decrease northward
|

|
|
Yearly and depth-averaged concentrations (Bq/m3) of 137Cs after 6 years from Harms' model The sources are instantaneous releases of 1 PBq from the dump sites in Abrosimov Bay, Stepovogo Bay, Tsivolky [..]
|

|
|
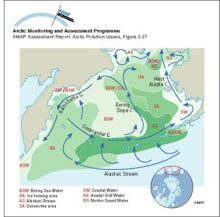
Schematic diagram of circulation and the extent of different water masses in the Bering Sea
|
|
|
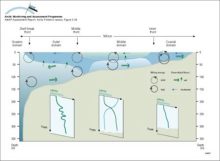
The different domains of the Bering Sea continental shelf are separated by fronts The coastal domain (depth <50m) tends to be vertically homogeneous, the middle domain (50-100m) shows a clear [..]
|
|
|
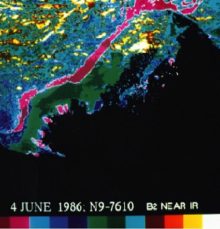
Advanced Very High Resolution Radiometer (AVHRR) satellite image (June 4, 1986) showing a color composite of the visible data band for the Mackenzie Delta River water overflowing the landfast ice can [..]
|
|
|
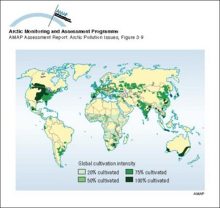
Global distribution of cultivation intensity based on a 1° x 1° latitude/longitude grid
|
|
|
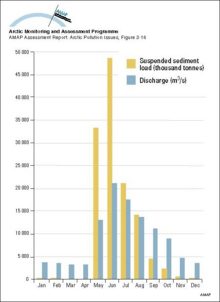
Comparison of monthly water and suspended sediment loads to the Mackenzie Delta plain for the period 1974-1983
|
|
|
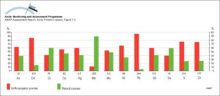
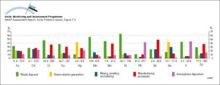
Comparison of global emissions of trace metals to the atmosphere from natural and anthropogenic sources in 1983 Numbers under the columns are the median values of estimates of total emissions in [..]
|
|
|
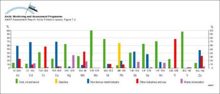
Global emissions of trace metals to the atmosphere at the beginning of the 1980s from anthropogenic sources
|
|
|
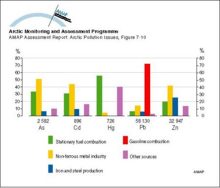
Global emissions of Pb to the atmosphere from various sources and source regions in 1989 Numbers under the columns are maximum estimates of the total emissions in tonnes
|

|
|
Spatial distribution of global emissions of Hg in 1990 within a 1° x 1° grid The total emission inventory is 2144 tonnes Hg
|

|
|
Contributions from different continents and from different sources to the global emissions of Hg to the atmosphere
|

|
|
Global anthropogenic inputs of trace metals to aquatic ecosystems at the beginning of the 1980s Numbers under the columns are the range of estimates of the inputs in thousands of tonnes per year
|
|
|
Emissions of selected heavy metals to the atmosphere in Europe at the beginning of the 1990s Numbers under the columns are emissions in tonnes per year
|
|

water OR waste searches for either of these words
oceans AND biodiversity searches for blocks with both words
pollution NEAR water searches for blocks with either of these words, with them being closer ranks higher
"climate change" searches for this phrase