Bacterioplankton growth
|
||||
Key Message
Bacterioplankton growth rate is a powerful indicator of the decomposition of organic matter and thereby trophic status of the Sea. The bacterioplankton accounts for half of the pelagic oxygen consumption.
The bacterioplankton growth rate indicates good trophic status in the off-shore Bothnian Bay and Bothnian Sea. Deep water growth rates were only 50% higher than at corresponding depths in the Atlantic Ocean, lacking excess enrichment. The bacterial growth has been stable for the past 15 years, suggesting a balanced nutrient supply to and organic production in the two basins.
Relevance of the indicator for describing developments of the environment
Bacterioplankton growth rate is an indicator of the nutrient status in aquatic environments. It is an estimate of the consumption of organic carbon in the ecosystem and therefore closely related to the biochemical oxygen demand in situ (cf. BOD7). Bacterioplankton growth rate thereby indicate the rate of oxygen consumption that may lead to oxygen deficiency in the water column when exceeding oxygen supply. The bacterial growth rate indicator may be used in all aquatic environments.
Bacterioplankton growth rate is a relatively unambiguous indicator of the flux of organic matter in the pelagic ecosystem (Billen, Servais et al. 1990). Even if the relationship between the factors specific growth rate and abundance may vary, their product representing biomass production reflects the substrate requirement of the bacterial community. Density limitation (i.e. competition) or other limiting factors (i.e. inorganic nutrients, temperature) do not therefore directly appear to control the bacterial community biomass production at typical environmental conditions. This agrees with empirical observations that bacterial growth rate over larger scales correlate with trophic status of a system (Cole, Findlay et al. 1988; Billen, Servais et al. 1990) , and at smaller scales between water layers and seasons (Wikner and Hagström 1999).
Results
The bacterioplankton growth in the deep water (40-100 m) was stable during 1994-2008 in both the off-shore areas of the Bothnian Bay and Bothnian Sea. No significant linear trends could be demonstrated for the whole period (Table 1).
Periods of higher and lower growth in the deep water, however, occurred at all stations (c.f. Statistics). The most marked peak occurred at station BMP-A13 during 1997 and BMP-A5 2002.
The bacterioplankton growth was on average 27,5 nmol C dm-3 day-1 in the Bothnian Bay, while being 21 % higher in the Bothnian Sea (p=0.002 , Table 1). The higher value in the Bothnian Sea was in good accordance with the expected higher trophic status of this basin.
The ability of bacterial community growth to measure changes in nutrient supply was shown by the seasonally recurrent variation in the deep water by a factor of 3 (data not shown). Highest values occurred duing the summer months when highest sedimentation is expected.
The bacterioplankton growth in the Bothnian Sea corresponded to a bacterial oxygen consumption of 1.2 µmol O2 dm-3 day-1, assuming a bacterial growth to growth efficiency function according to del Giorgio and Cole (1998). The oxygen consumption could be compared to the average oxygen concentrations of 383 and 267 µmol dm-3, respectively, for the Bothnian Bay and Bothnian Sea. Assuming bacterioplankton to account for half of the total respiration (Robisnon and Williams, 2005), average daily oxygen consumption would correspond to 0,49 and 0,87 % day -1, respectively.
Assessment
The bacterioplankton growth rate in the deep water of the Bothnian Bay and Bothnian Sea was at a level assessed as representing good conditions. This indicates that the export of organic matter by sedimentation to the deep water has been low and stable. The quality factor does therefore not support that these basins are disturbed by eutrophication.
The conclusion was based on that the level of bacterioplankton growth found in the Bothnian Bay and Sea are comparable to rates at similar depth of oceanic water (Dufour and Torreton 1996). Another way to compare this is by absolute rates of total oxygen consumption calculated from the bacterial growth (assuming 50% due to bacterial growth). The levels in the Gulf of Bothnia was only 50 % higher than the mean oxygen consumption, measured at the same depth interval in the ocean (Robinson and Williams 2005). As elevated nutrient levels are unlikely to occur in the open ocean this suggests that the current level of oxygen consumption in the Bothnian Bay and Sea are at the status “good” or better.
The lack of significant decrease of oxygen levels in the Bothnian Bay since the beginning of the 1970´s, further corroborate that oxygen supply to the deep water has been and remained sufficient to account for total respiration. Decline in oxygen concentration that has been observed in the Bothnian Sea during the past 12 years make the classification more difficult for this basin. That only 21 % higher growth rate in the Bothnian Sea than Bay could alone explain the decline seems unlikely. Other factors like import of oxygen deficient water from the Baltic Proper or increased stratification may rather explain this development.
A management consequence of the low rates observed is that it will be extraordinarily difficult to reduce them further by nutrient reductions.
The lack of significant long term and monotonic trends further suggest that the trophic conditions in these basins have been stable for the past decade. Any monotonic trends occurring must be less than 4,4 % year-1, based on the power of the time series (±95% C.I., Table 1).
Data description
Values
The bacterioplankton growth estimates are based on uptake of the nucleotide thymidine into the DNA (i.e. chromosome) of the bacteria. The original method is published in international scientific journals and has been used in many marine research studies since the beginning of the 1980´s. The method has been part of the Helsinki commission guidelines for a longer period of time (Baltic Sea Environment Proceedings No. 27D) and is recently re-introduced into the COMBINE manual part C (Annex C-12).
Values were averaged for the depths sampled within the water layer chosen (n=4). Typically 8-20 samplings distributed over the year were included.
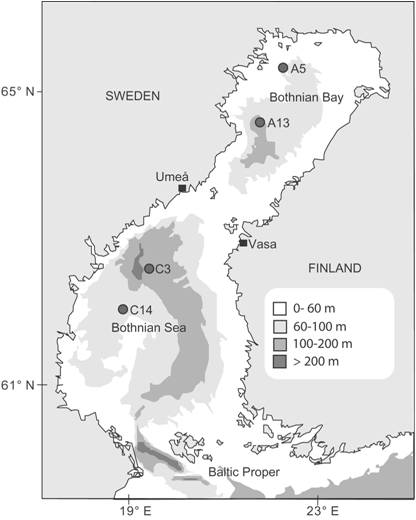
Figure 1. Sampling stations in the Gulf of Bothnia.
Statistics
Missing values were replaced by linear interpolation and averaged to yield monthly time series, as required for the seasonal decomposition. About 20% of the values in the analysed time series were interpolated. Time series were seasonally decomposed by a multiplicative model and endpoints weighted by 0,5 in the software SPSS®.
Time series were typically serially autocorrelated by one lag and therefore analyzed for trends by first order autoregression (SPSS®). It uses a least-square technique where errors follow a first order autoregression.
To show the general trends in the time series a negative exponential smoother was applied. This is a local smoothing technique using polynomial regression and weights computed from the Gaussian density function (SigmaPlot 8.0®).
The power of the time series was estimated from the standard deviation of the autoregression (Root Mean Square Error), the non-centrality parameter and the non-central t-distibution. As a guidance to assess significant changes, a difference of 25 % in 2 years is expected to be detected with 80 % probability.
The difference between the Bothnian Bay and Bothnian Sea was tested by an ANOVA on natural logarithm transformed bacterial growth, where area and year were fix factors, and month a co-variate.
Figures
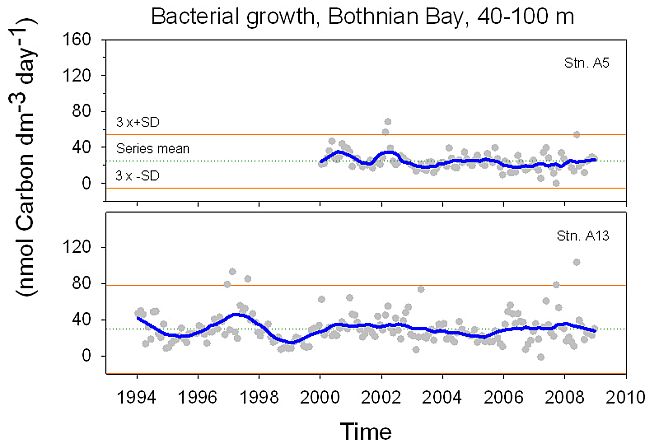
Figure 2. The bacterioplankton growth rate below the stratified layer has been stable in the Bothnian Bay since 1994. A negative exponential smoother is shown together with seasonally adjusted data. The 3 x SD lines represent the upper and lower 99% confidence limits of the smoothed time series, suggested as action limits for the quality factor. Year ticks are located at the 1 st of January each year.
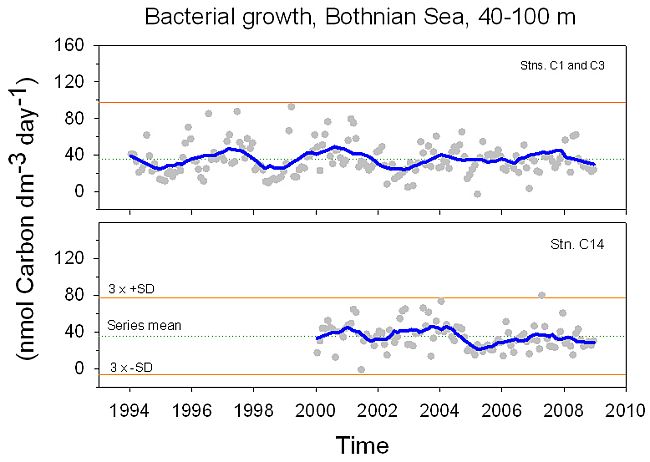
Figure 3. The bacterioplankton growth rate below the stratified layer has been stable in the Bothnian Sea. Lines defined as in figure 2.
Tables
Table 1. Bacterial community growth below the pycnocline level has been stable in the Bothnian Bay and Bothnian Sea. This analysis was based on the whole time serie period. The confidence interval (±95% C.I.), also shows how large the trend at least would have to be to achieve statistical significance. The significance (α) shows the risk to be wrong if stating that there is a trend, which should be below 5% for a statistical significant statement. The series mean of bacterial growth rate is shown.
| Sea area | Station | Trend | ±95% C.I. | α | Years | Bacterial growth rate | |
| (% year-1) | (% year-1) | (%) | (nmol C dm-3 day-1) | ||||
| Bothnian Bay | A5 | -4,0 | 4,4 | 7,4 | 9 | 25 | |
| Bothnian Bay | A13 | -0,1 | 2,6 | 97 | 15 | 30 | |
| Bothnian Sea | C1 and C3 | 0,5 | 2,6 | 69 | 15 | 36 | |
| Bothnian Sea | C14 | -3,2 | 4,0 | 12 | 9 | 35 | |
References
Billen, G., P. Servais, et al. (1990). "Dynamics of bacterioplankton in oligotrophic and eutrophic aquatic environments: bottom-up or top-down control ?" Hydrobiologia 207: 37-42.
Cole, J. J., S. Findlay, et al. (1988). "Bacterial production in fresh and saltwater ecosystems: a cross systems overview." Marine Ecology-Progress Series 43: 1-10.
del Giorgio, P. A. and J. J. Cole (1998). "Bacterial growth efficiency in natural aquatic systems." Annu. Rev. Ecol. Syst. 29: 503-541.
Dufour, P. H. and J. P. Torreton (1996). "Bottom-up and top-down control of bacterioplankton from eutrophic to oligotrophic sites in the tropical northeastern Atlantic Ocean." Deep-Sea Research Part I-Oceanographic Research Papers 43(8): 1305-1320.
Robinson, C. and P. L. Williams (2005). Respiration and it´s measurement in surface marine waters. Respiration in aquatic ecosystems. P. A. del Giorgio and P. L. Williams. Oxford, Oxford University Press. 1: 147-180.
Wikner, J. and Å. Hagström (1999). "Bacterioplankton intra-annual variability at various allochthonous loading: Importance of hydrography and competition." Aquatic Microbial Ecology 20: 245-260.
For reference purposes, please cite this indicator fact sheet as follows:
[Author’s name(s)], [Year]. [Indicator Fact Sheet title]. HELCOM Indicator Fact Sheets 2009. Online. [Date Viewed], http://www.helcom.fi/environment2/ifs/en_GB/cover/.
Last updated: 28 September 2009
