Emissions from the Baltic Sea shipping in 2008
|
||||
Key messages:
Baltic Sea ship emissions during 2008 have decreased when compared to 2007
- NOx, 393 kt/year, decrease from 400 kt ( -1.75 %)
- SOx, 135 kt/year, decrease from 137 kt (-1.5 %)
- CO2 output, fuel consumption and energy content have all decreased ( -2 %) during 2008:
- CO2, 18.9 Mt/year, decrease from 19.3 Mt
- Fuel consumption, 6056 kt/year, decrease from 6205 kt
- Energy consumption, 259 PJ decrease from 264 PJ
- Number of ships observed during 2008 was 10773 vessels, increase from 9497 (+11.8 %)
Results and assessment
Relevance of the indicator for describing the developments
This indicator shows the annual emission levels of NOx, SOx and CO2 arising from ship traffic in the Baltic Sea area in 2008, as well as their change from the previous year.
Policy relevance and policy reference
The Baltic Sea SECA (SOx Emission Control Area) entered into force during 2006. The year 2008 was the second full calendar year with the SECA in effect. A slightly decreasing trend in SOx emissions is estimated (Fig. 1).
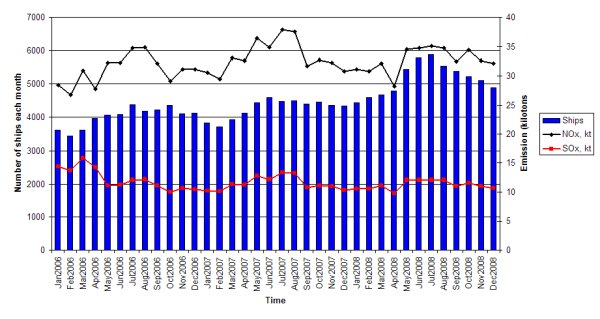
Figure 1. Monthly developments in ship numbers and exhaust emissions, 2006-2008
After the 1.5 mass-% limit for fuel sulphur content became effective, the baseline SOx emissions from ships have decreased steadily. Both NOx and SOx emissions peak during the summer months but the overall trend for SOx is decreasing. The emissions of NOx seem to be leveling off after a strong increase in 2006-2007, probably due to global financial crisis and the smaller volumes of cargo transported. The number of crude oil tankers, bulk cargo and general cargo ships decreased during 2008 when compared to the year 2007. In contrast, the number of small vessels increased significantly especially during summer months.
Future limitations in Emission Control Areas(ECA)
Upcoming EU directive 2005/33/EC will forbid the usage of marine fuels having >0.1 mass-% of sulphur in harbor areas. This directive will become effective on 1st of January 2010 and it will have an impact on local air quality near harbors. The impact of the directive on overall SOx emissions in the Baltic Sea area might not be large, but it is expected to reduce the health effects of ship traffic in situations where harbor areas are located near or inside big cities. In the 58th session of the Marine Environment Protection Committee (MEPC) of the International Maritime Organization (IMO) on October 2008 it was decided that the current 1.5 mass-% of sulphur limit in fuels inside the ECAs will be decreased to 1.0 mass-% starting from 1st of July 2010. The decreasing trend in sulphur emissions from ships in the Baltic Sea area is therefore expected to continue.
Assessment
Emission inventories for shipping were prepared using the data from HELCOM Automatic Identification System (AIS) database. Based on this data it is possible to pinpoint every ship using an active AIS transmitter, determine its current speed and combine this information with detailed technical knowledge of ships’ engines to produce an estimate of emissions and fuel consumption. The software and its application to the Baltic Sea area are described elsewhere[1].
Over 247 million position reports were analyzed. In 2008 there were 4400-5900 ships with an active AIS transmitter sailing the Baltic Sea each month and at any given moment there were >2000 vessels. NOx emission from ships alone reached 393 kilotons during 2008 showing ~7 kt decrease from previous year. Fuel consumption was estimated as 6056 kilotons, which corresponds to 259 Petajoules of energy consumed and 18.9 megatons of CO2 produced by ships. Favorable development of the NOx emissions can probably be attributed mostly to the global financial crisis, however, and not yet to effective emission control measures. The decrease in economic activity in the Baltic Sea area slightly decreased the traffic volumes and the amount of cargo transported through Finnish harbors[3]. The emission estimates for the last quarter of 2008 hinted that the strong growth of ship emissions had leveled off albeit temporarily.
To put these numbers in perspective combined NOx land emissions of Finland and Sweden was 368 kilotons in 2006[3]. When emissions are tabulated by country based on the flag state of the vessel, about 52 % of the NOx is found to be emitted by ships registered to some riparian state of the Baltic Sea, 16 % from other EU countries and 32 % from ships registered outside the European Union. These fractions of total NOx emission have remained similar to the year 2007. Further division to individual flags is shown in Figure 2.
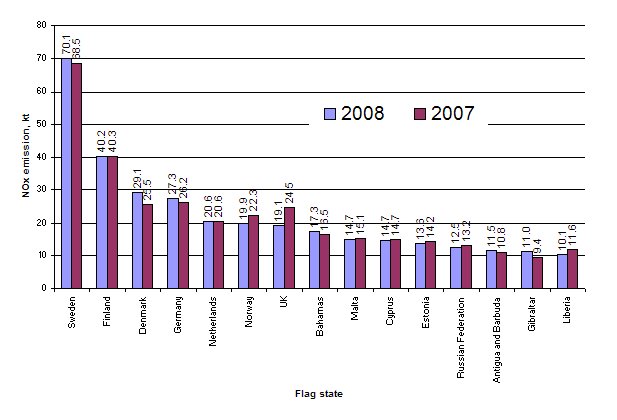
Figure 2. NOx emissions from ship traffic in the Baltic Sea area during 2007-2008. Emissions by flag state of ships. Emissions of over 10 kt are shown for clarity, constituting 84 % of total NOx emissions.
The three fleet from Nordic flag states, Sweden, Finland and Denmark, can be observed as major contributors to the NOx emissions from ships, albeit the share of their fleet of the total emissions has decreased slightly from 2007.
The geographical distribution of emissions can be seen in Figure 3.
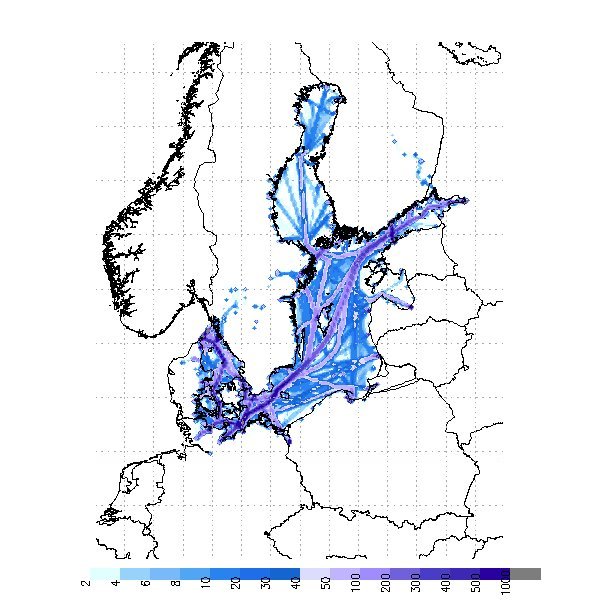
Figure 3. Total NOx emission sum, 2008. Values are given in tons per grid cell of 9 x 9 km.
The monthly variation reveals that the emissions and number of vessels peak at summer months. As can be seen from Figure 3, most of the emissions occur in Southern Baltic Sea and the Gulf of Finland. Emissions from shipping have slightly decreased in the southern Baltic Sea, but increased near Gothenburg, Sweden, on the Gulf of Finland and near St. Petersburg area (Figure 4).
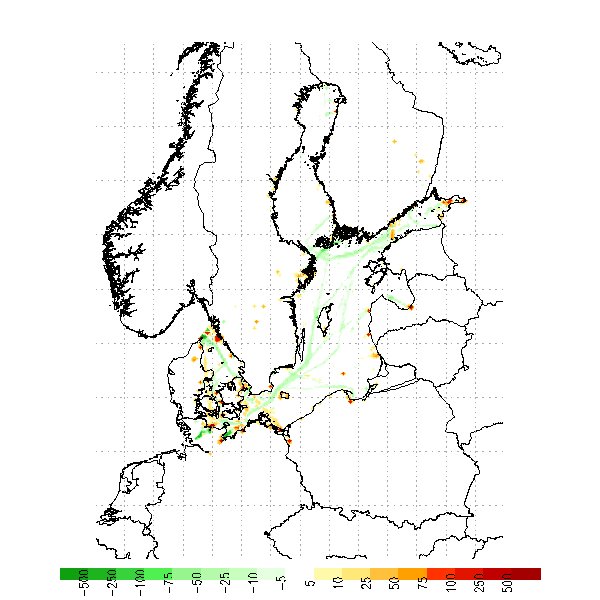
Figure 4. Difference (2008-2007) in annual NOx emission from ships (in tons/grid cell, 9 x 9 km rotated grid). Red color indicates increase in emissions, dark green indicates decreased emissions.
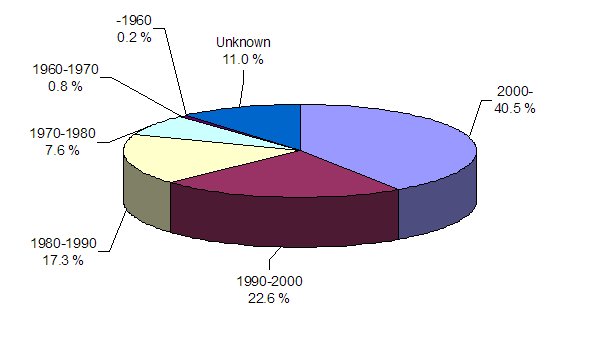
Figure 5. Annual NOx emission by build year. Total NOx emission is 393 kilotons.
By looking at the NOx emitted by age class of ships (Figure 5), it can be concluded that ~40 % of the emission comes from new ships, built after 1.1.2000. Ships built in 1990’s and 1980’s produce ~23 % and ~17 % of the NOx emissions, respectively. The share of newest ships has increased slightly from 2007, whereas the number of ships in older classes seems to decrease steadily.
Metadata
Technical information
Emission estimates for NOx are based on HELCOM AIS data collected by the member states. For that purpose, over 247 million position reports were analyzed which indicate the location and transient speed of every ship carrying an AIS transmitter as required by the IMO. Based on current speed-design speed relation and technical data of ships' engines, an emission estimate can be made based on instantaneous power levels of the engines. It is possible to extend emission evaluation to other areas where AIS data is readily available. Several emission abatement techniques are included and their impacts to emissions are modeled as are ship specific NOx emission certificates.
Quality information
The fuel consumption predictions are compared to real-world fuel consumption data from Finnish shipowners. However, more comprehensive checks are planned to gain better understanding of the development needs of the model. Currently the model produces values that are slightly underestimated and it is likely that in reality the emission levels and fuel consumption are larger than what is described in this document. Uncertainties are downplayed in a way that produce smaller emission estimates in order to get a baseline for NOx emissions. Detailed description of uncertainties and their magnitudes are given elsewhere[4]. Future enhancements include direct stack measurements onboard ships and inclusion of other pollutants (e.g. particulate matter) to enhance the accuracy of the emission model.
References
[1] J.-P. Jalkanen, A. Brink, J. Kalli, H. Pettersson, J. Kukkonen, and T. Stipa, ”A modelling system for the exhaust emissions of marine traffic and its application in the Baltic Sea area”, Atmos. Chem. Phys. Discuss., 9 (2009) 15339-15373.
[2] Finnish Maritime Adminstration, “Monthly statistics on shipping between Finland and foreign countries”, Official Statistics of Finland, 2008, ISSN 1795-5106
[3] Mareckova K., Wankmueller R., Anderl M., Muik B., Poupa S., Wieser M., EMEP - Technical Report CEIP 1/2008, "Inventory Review 2008 - Emission data reported under the LRTAP convention and NEC directive", Umweltbundesamt GmbH, Vienna, 2008, ISBN 3-85457-973-X
[4] Stipa T., Jalkanen J.-P., Hongisto M., Kalli J., Brink A., ”Emissions of NOx from Baltic Sea shipping and first estimates of their effects on air quality and eutrophication of the Baltic Sea”, ISBN 978-951-53-3028-4, Helsinki, Finland 2007. Available from http://www.helcom.fi/press_office/news_helcom/en_GB/HELCOM_submission_to_IMO/
For reference purposes, please cite this indicator fact sheet as follows:
[Author’s name(s)], [Year]. [Indicator Fact Sheet title]. HELCOM Indicator Fact Sheets 2009. Online. [Date Viewed], http://www.helcom.fi/environment2/ifs/en_GB/cover/.
Last updated: 29 September 2009
