Hexabromocyclododecane (HBCD) concentrations in herring muscle and Guillemot egg

|
||||
Key message
The concentration of HBCD in Guillemot egg show a significant increase of about 3% per year. A significant decreasing trend can be seen for HBCD in herring muscle from Utlängan in the southern Baltic Proper during the monitored time period, 1999-2007. No significant trend can be found at the other monitored localities.

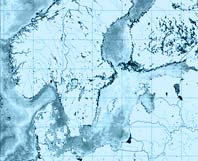
Figure 1. Spatial variation in mean concentration (of the annual mean values 2004-2007 in ng/g lipid weight) of HBCD in herring muscle. The highest concentration (around 35 ng/g ) was found in the southern part of Baltic Proper (Hanöbukten), the lowest (around 4 ng/g) in Skagerrakk (Väderöarna). Data originates from the Swedish national monitoring programme. Some of the sampling sites have only been analysed one year this far (among them Hanöbukten).
Results and assessments
Relevance of the indicator for describing developments in the environment
Analyses of contaminants in biotic samples, in contrast to abiotic matrices, exhibit the bioavaillable part of the contaminants. The lipid content of both herring muscle tissue and guillemot eggs is high, about 2-4% and 11-13% respectively, and thus very appropriate for analysis of fat-soluble contaminants as HBCD. Herring is commonly used for human consumption.
Policy relevance and policy references
At this time a risk assessment of HBCD is performed within the EU’s programme for existing substances. The outcome of the EU’s risk management strategies for HBCD, following the risk assessment will possibly call for future regulation.
HBCD is only produced at one industrial unit within the EU. The Swedish import of HBCD has decreased from about 120 to 3.5 tonnes per year during the time period 1997-2004.
Assessment
The concentrations of HBCD in Guillemot eggs show a significant increase of about 3% per year whereas HBCD in herring muscle from Utlängan show a decreasing trend during the monitored time period, 1999-2007. No trend can be seen at the other sites. The map indicates elevated concentrations in the Baltic Proper compared to the Gulf of Bothnia and the Swedish west coast. The highest concentration in herring muscle (around 35 ng/g ) was found in the southern part of the Baltic Proper (Hanöbukten) and the lowest (around 4 ng/g) in Skagerrak (Väderöarna). The between-year variation from the sampling site in the southern Baltic Proper is however possibly large.

Figure 2. Temporal trends of HBCD concentration (ng/g lipid weight) in herring muscle from four different sampling sites in the Baltic Sea (1999-2007). Harufjärden (Bothnian Bay), Ängskärsklubb (S. Bothnian Sea), Landsort (N. Baltic Proper), Utlängan (S. Baltic Proper). The red line presented in one of the figures is based on a log-linear regression analyses and shows a decreasing trend. The linear dotted line is the mean concentration of the analysed period.

Figure 3. Temporal trend of HBCD concentration (ng/g lipid weight) in guillemot egg (1969-2007) from St. Karlsö. The red line shows an increasing trend of 3% per year.
References
Bignert, A., Danielsson S., Strandmark A., Nyberg E., Asplund L., Eriksson U., Wilander A. Haglund P. 2008. Comments Concerning the National Swedish Contaminant Monitoring Programme in Marine Biota. Report to the Swedish Environmental Protection Agency, 2008. 128 pp.
KemI (2006). Hexabromcyklododekan (HBCDD) och tetrabrombisfenol - A (TBBPA). Rapport 3/06.
Data
Trend (in %) assessed from the geometric mean of concentrations of HBCD (ng/g lipid weight) in various matrices and sites during the time period 1999-2007 and the estimated mean concentration for the last year (2007). The numbers presented in brackets are the 95% confidence intervals. The age intervals for fish are also presented together with the total number of analyses and the number of years of the various time-series.

Metadata
Technical information
Data source: The National Swedish Monitoring Program of Contaminants in Biota
Sampling, sample preparation, storage in specimen bank and evaluation of results are carried out by the Department of Contaminant Research at the Swedish Museum of Natural History, Stockholm. Chemical Analysis is carried out at Institute of Applied Environmental Research at Stockholm University.
Geographical coverage: see data table and map.
Temporal coverage: see data table and figures.
Methodology and frequency of data collection, see Bignert et al, 2008
Methodology of data manipulation. For a detailed description of statistical methods use, see Bignert et al. 2008.
Quality information
The number of years required to detect an annual change of 5% with a power of 80% varied between 15 to 23 years for the herring time-series. The number of years required to detect an annual change of 5% was 18 years for the whole guillemot egg time-series and 11 years for the last ten years.
For reference purposes, please cite this indicator fact sheet as follows:
[Author’s name(s)], [Year]. [Indicator Fact Sheet title]. HELCOM Indicator Fact Sheets 2009. Online. [Date Viewed], http://www.helcom.fi/environment2/ifs/en_GB/cover/.
Last updated: 2 October 2009

